Indian E-Commerce War: Amazon vs Flipkart
When you talk about Indian e-commerce, Amazon and Flipkart are the rulers in this hotly contested space. Flipkart, a homegrown e-commerce platform, and Amazon’s Indian arm each reportedly have market shares of over 30% in the country’s online retail market.
In this article, we take a look at our transactional e-receipt consumer panel in India to see what consumer intelligence and actionable insights we can extract.
MAI’s India eCommerce Panel Overview
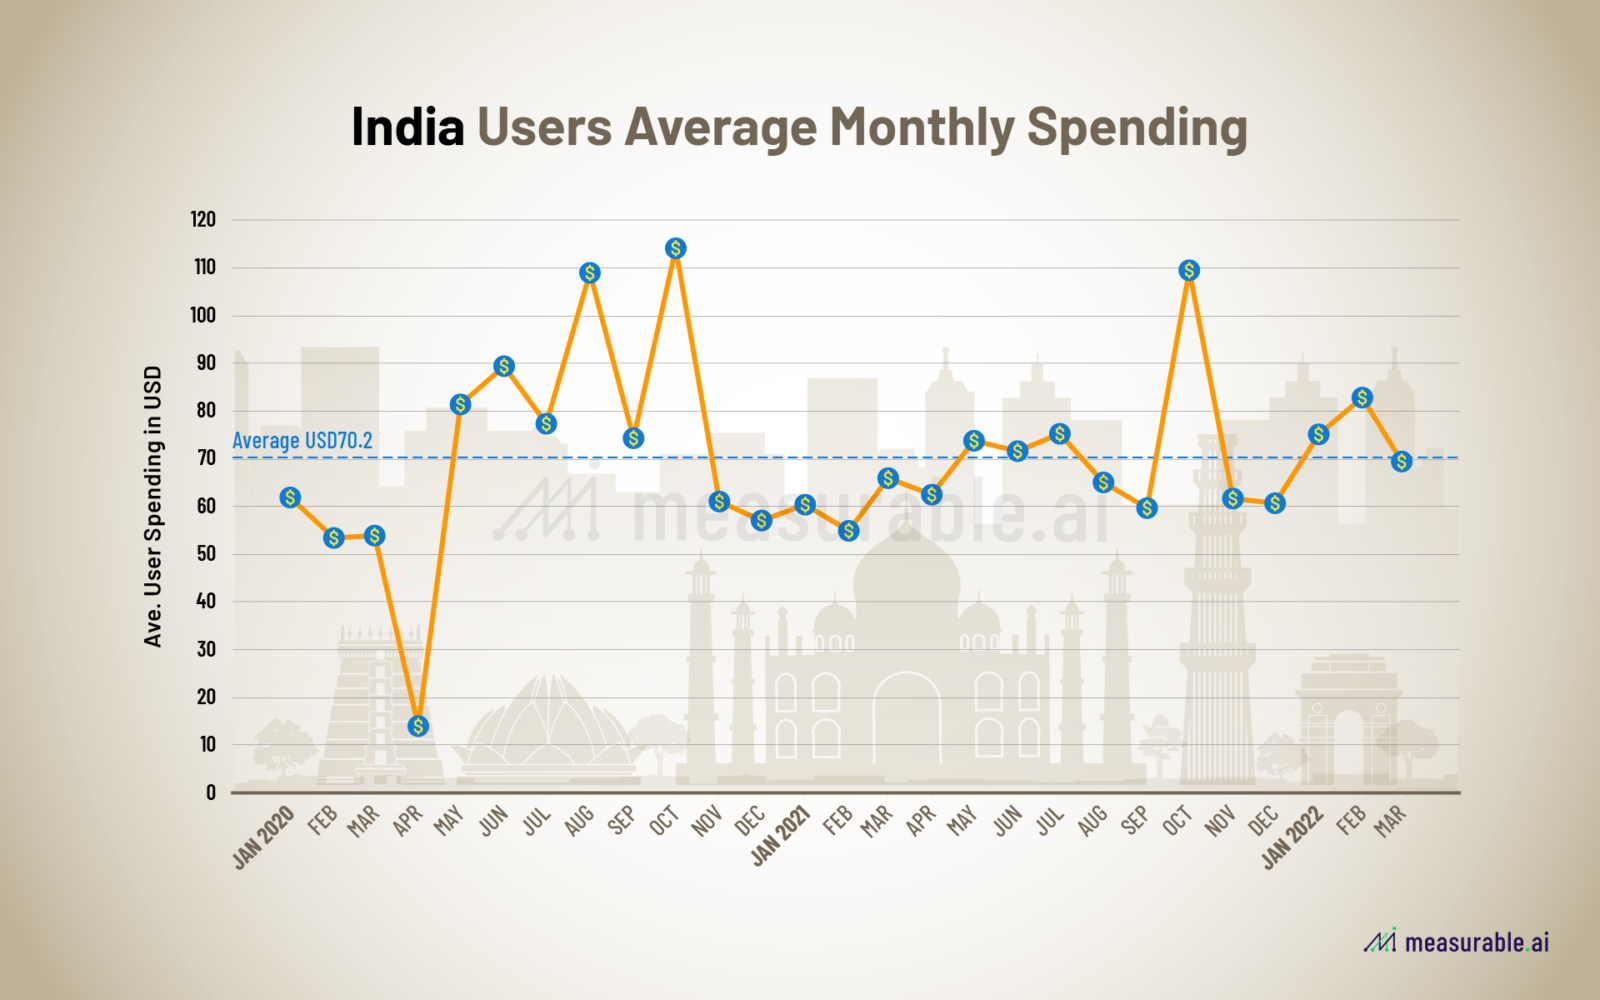
So how much does the average Indian consumer spend? Diving into MAI’s unique consumer panel data of email receipts for Amazon and Flipkart India, we estimate that the average spend is around $70 USD each month across both platforms for Indian consumers.
Looking into our panel GMV data, we witnessed Amazon India overall enjoying more sales. The uptick in sales during the October months for years 2020 and 2021 corresponds to India’s festive season whereby Amazon and Flipkart compete head on head for the best month long sales season. Amazon runs its “Great Indian Festival”, while Flipkart coins its massive October sales as the “Big Billion Days Sale”.
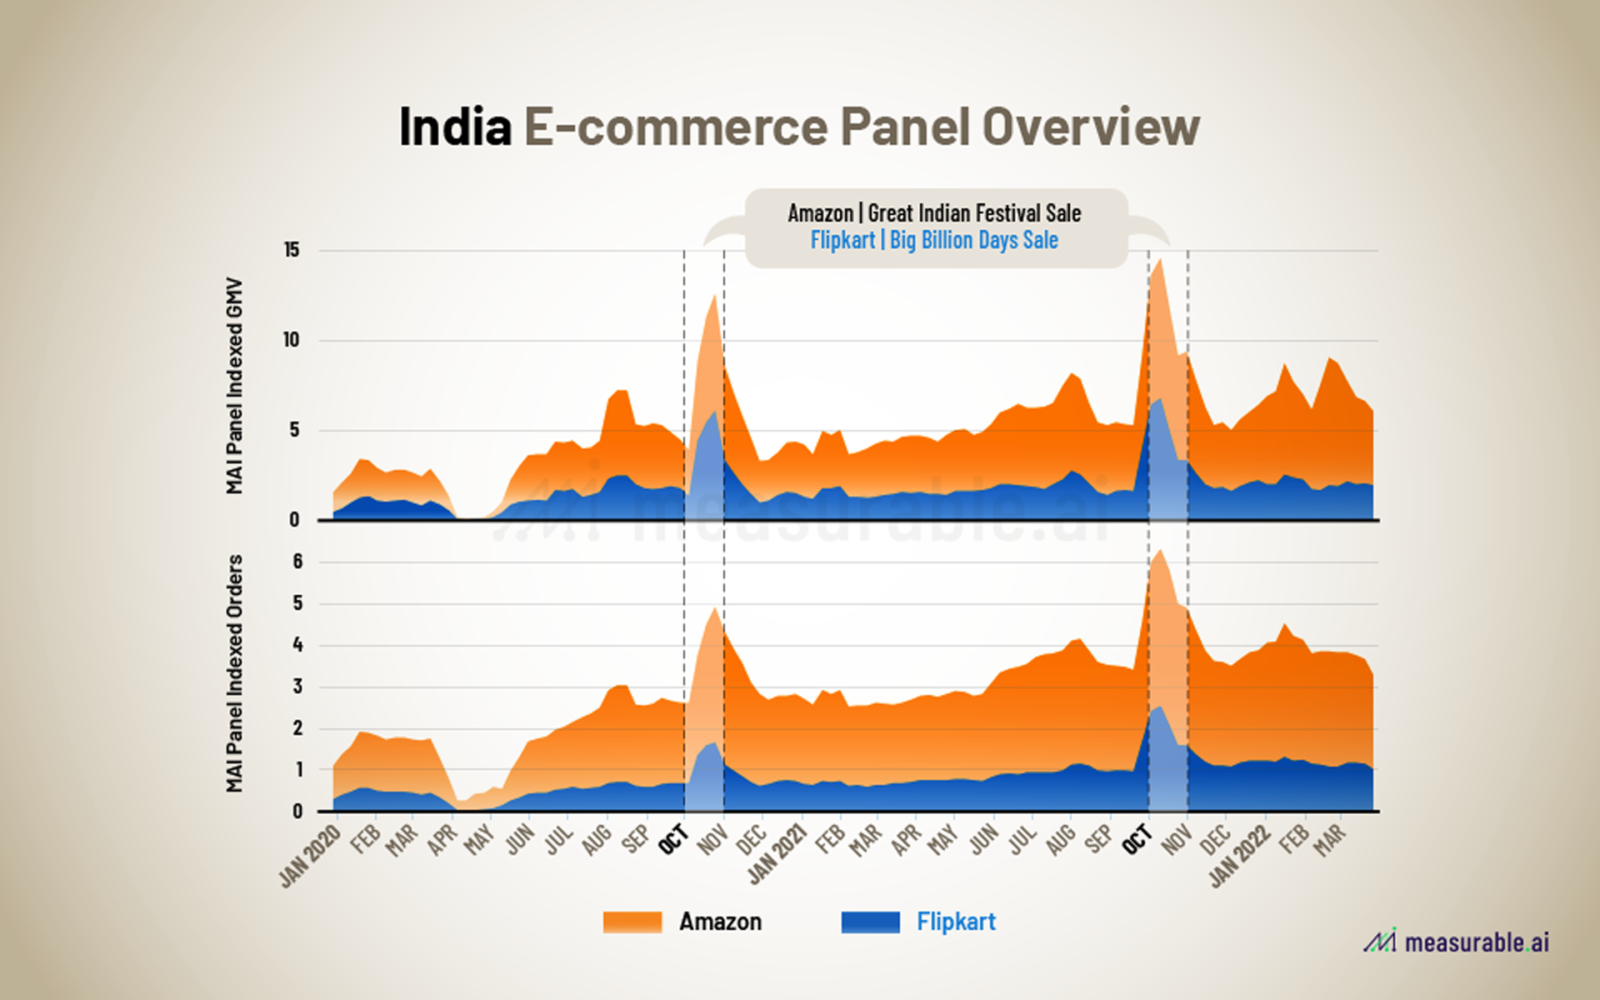
We are not surprised to see the massive spike in October 2021 last year as the two rivals both prolonged the duration of their sales during the festive month. As reported by IBEF, in October 2021 during the festive season in India, the e-commerce sales reached US$ 4.6 billion.
Meanwhile, the dip in April 2020 can be explained by the first nationwide lockdowns in India which started at the end of March due to the pandemic. While offline stores were shut, online stores remained operational (logistics however, were impacted). After a sharp decrease in April, online spending picked up again in May 2020.
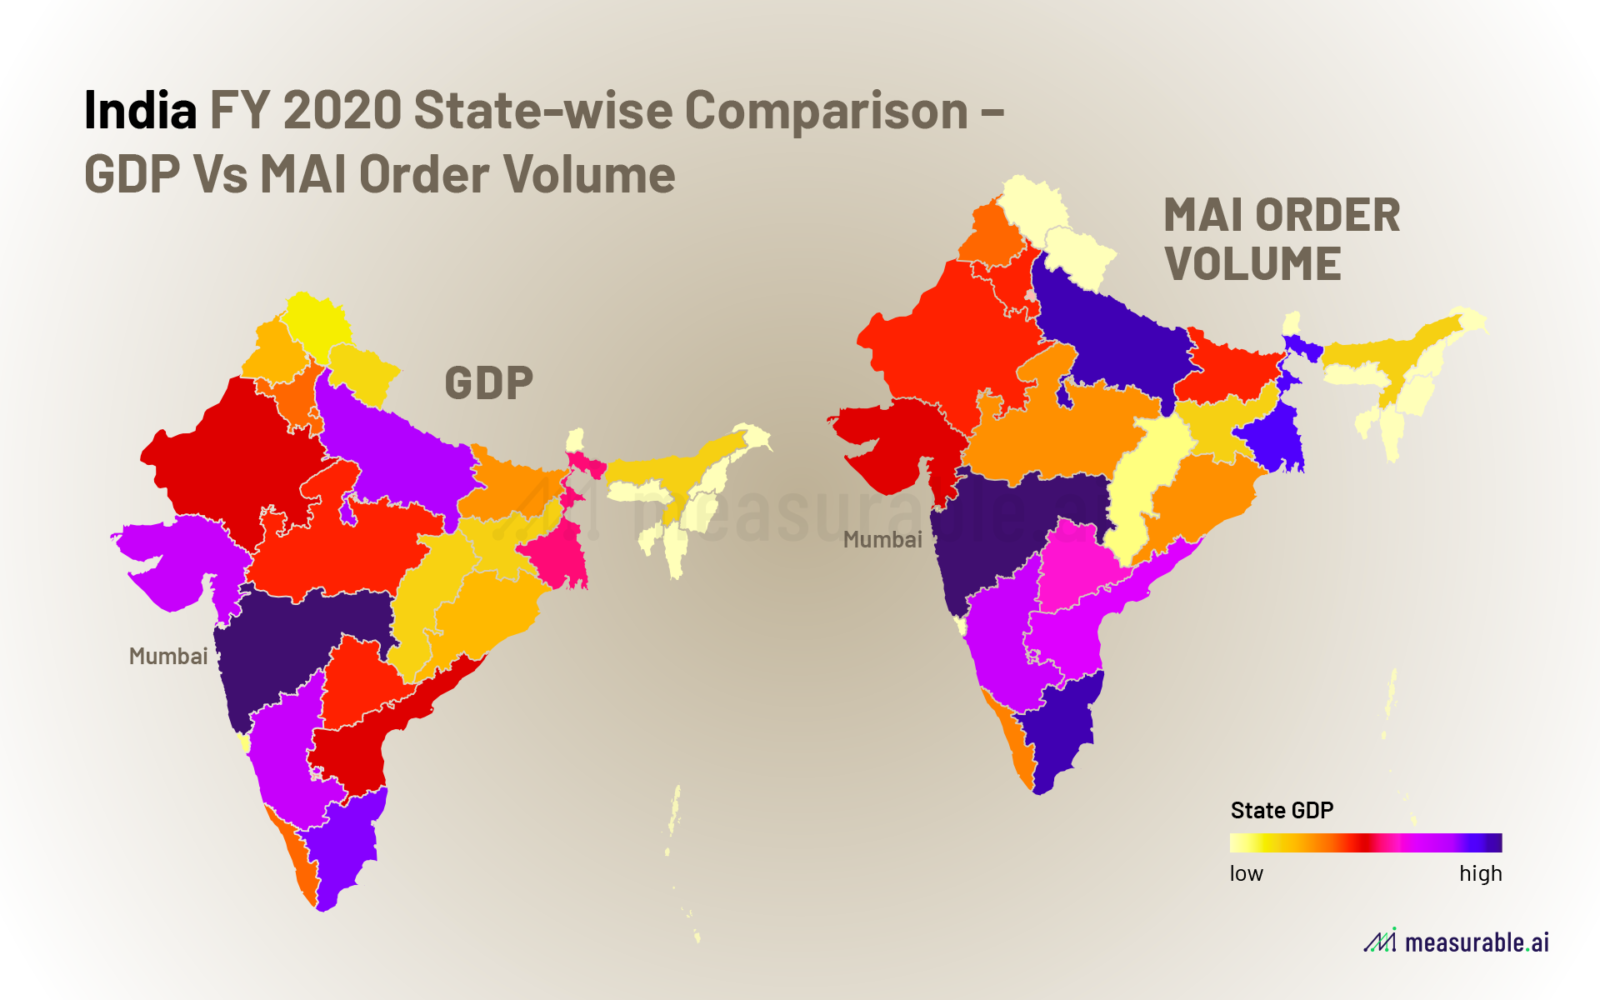
Validation of our Panel: India State-wise Comparison GDP vs MAI Order Volume
We mapped out GDP per state in India vs order volumes revealed in our dataset. As expected, states exhibiting higher GDP corresponded to higher order volumes in our panel.
Comparison of Premium Users of Amazon vs Flipkart
Another interesting comparison is the premium service offered by these two companies. Our panel reveals that amongst Amazon users, 20% subscribe to their Prime service whereas for Flipkart, neary 50% of its users are on their premium package.
Most of you are probably aware of Amazon Prime. A step up from the basic Amazon users, Amazon prime offers its members free delivery at a monthly subscription price of Rs 179 (or yearly offer at Rs 1499). The suite includes other services like Prime Video, Prime Music.
Flipkart’s equivalent to Amazon Prime is Flipkart Plus. Unlike Amazon Prime which needs to be paid for, Flipkart Plus is an earned loyalty program with no subscription fee. Benefits include access to special marketplace launch previews, availing free and fast delivery. Other perks include prioritized customer support, gaining unique Flipkart Pay Later options and curated benefits from ecosystem partners (across travel, OTT, F&B, lifestyle, and health and fitness).
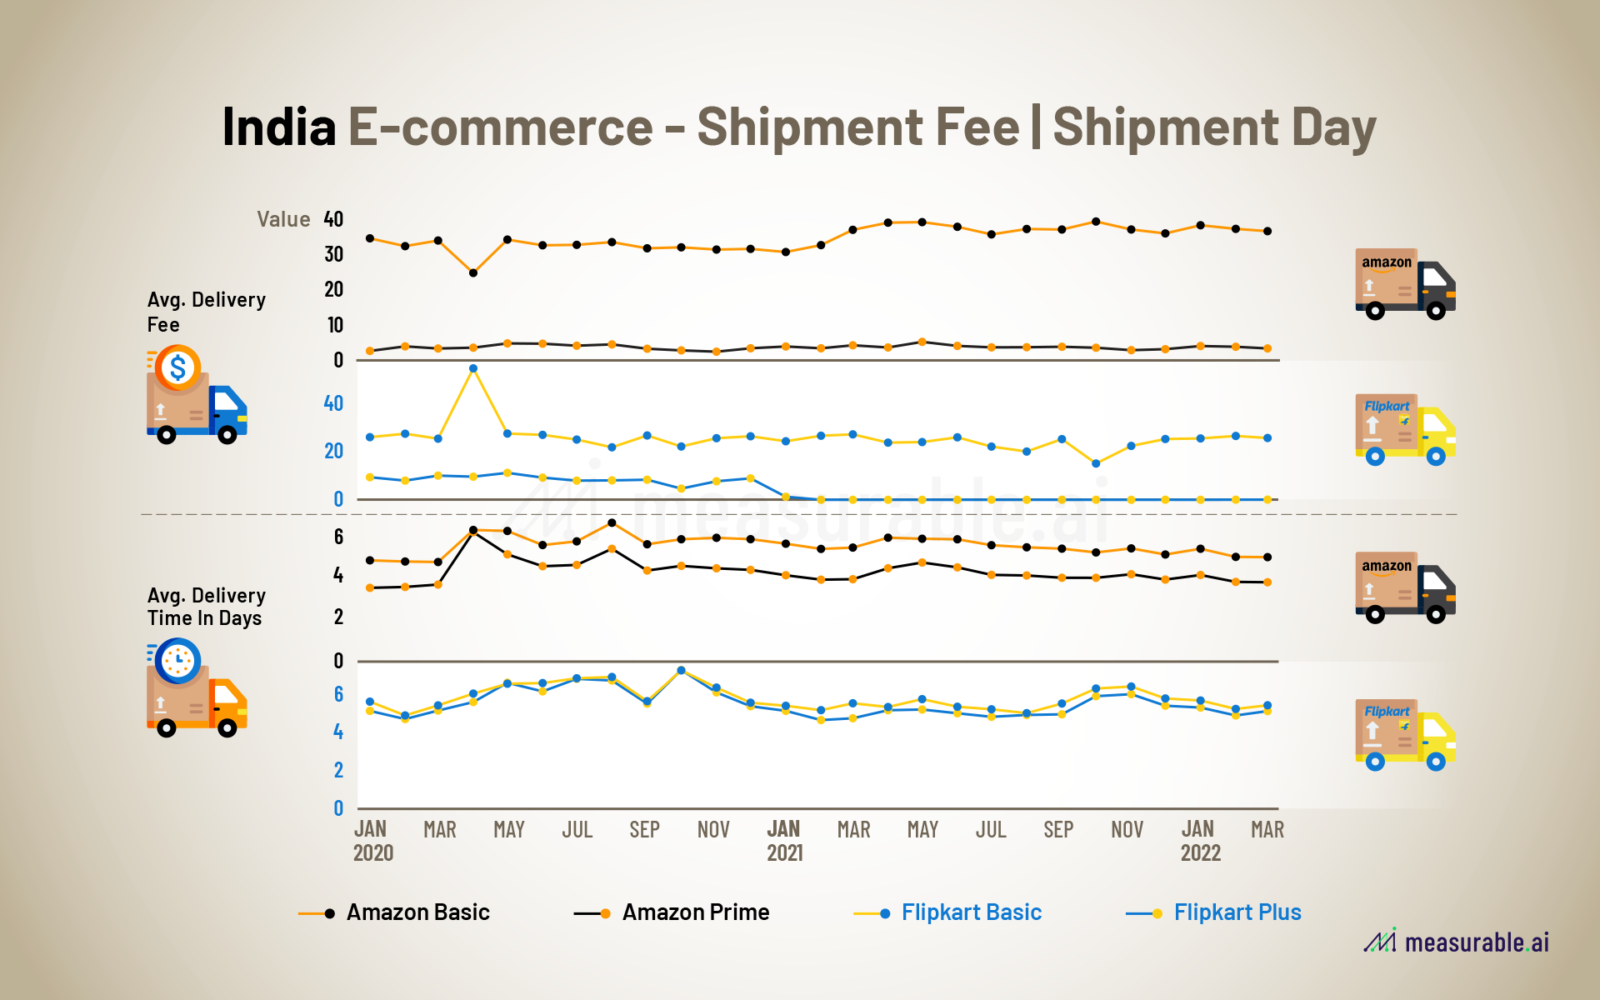
Delivery Fee and Shipment Days Comparison
While both competitor’s premium members enjoy lower delivery fees than the regular users, Amazon’s delivery fee for its Prime members is lower than Flipkart’s Plus. Noticeably, Flipkart has reduced its delivery fees and kept it reduced since 2021.
In terms of delivery time, we estimated this variable in our e-receipt panel by the date/time gap between the order confirmation email and the order delivered email to our panel members. For basic users of both companies, the delivery time seems to be pretty much the same. However, Amazon Prime members seem to enjoy marginally faster delivery times when compared to Flipkart Plus members.
Which Platform Exhibits Better User Retention?
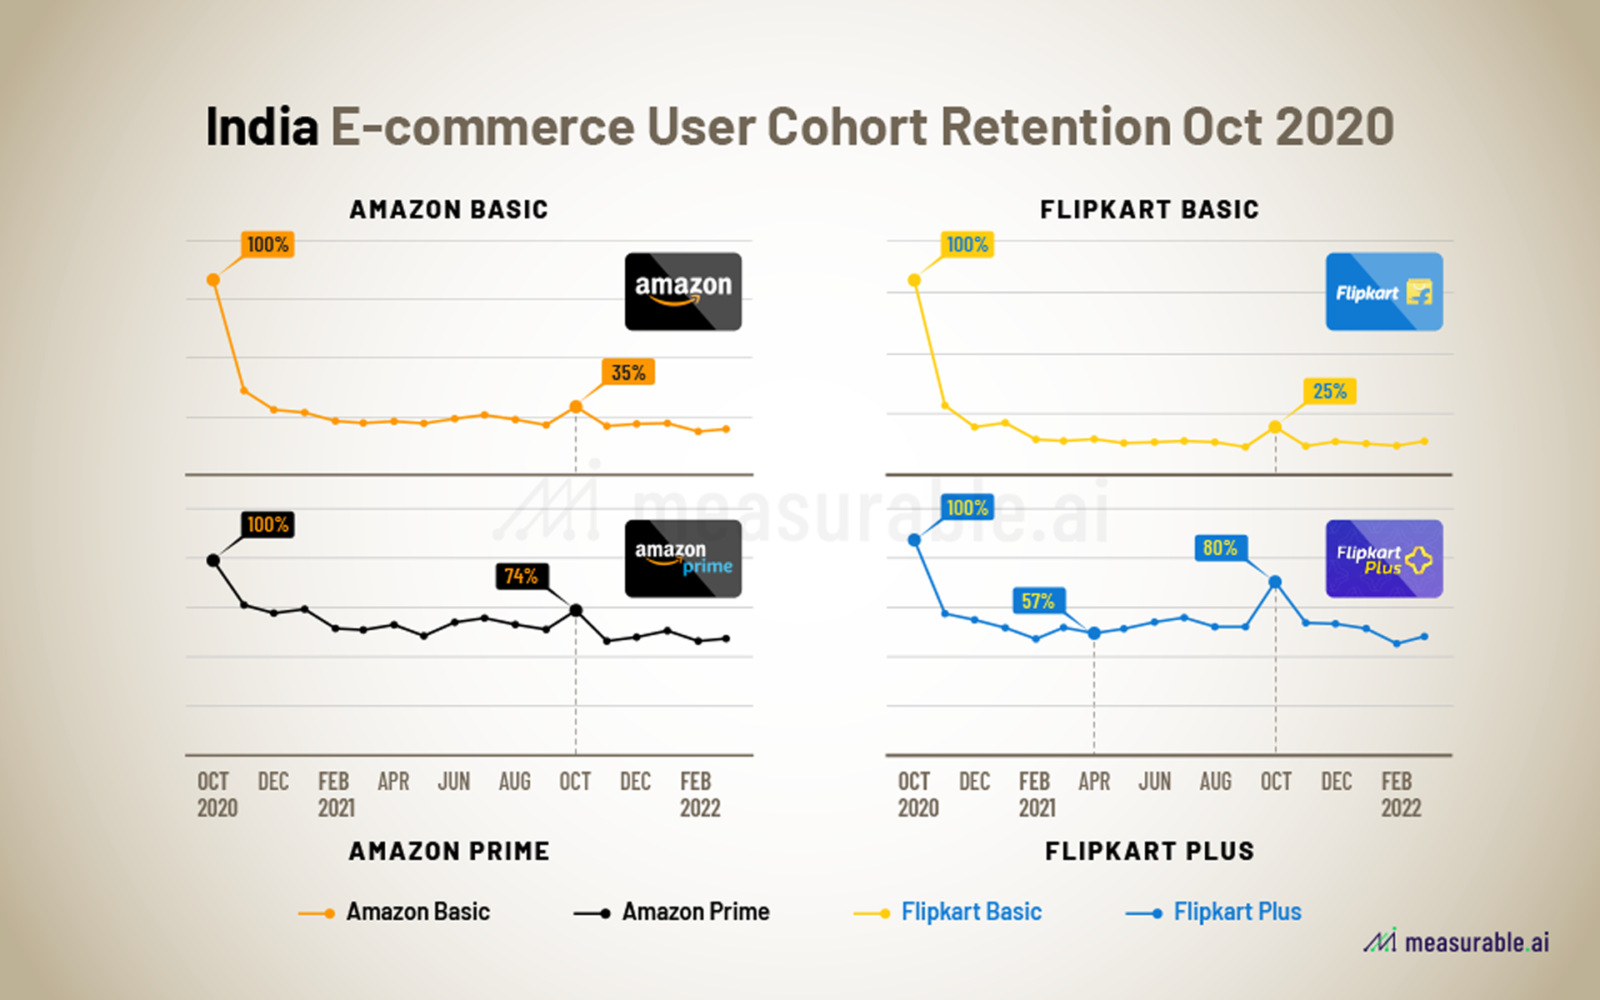
To understand more about consumer shopping behavour in India, we took out a cohort in our sample to observe any changes in spending patterns after the festive month-long October 2020 sales.
Looking at our data, the basic members of both platforms don’t seem to be too loyal to either of the two rivals. Amongst its basic users, Amazon exhibited a 35% retention rate in between the two October festive months 2021 vs 2020 whereas for Flipkart, our data reveals a 25% retention rate for the Walmart backed e-commerce platform.
Contrast this to the premium members of both e-commerce companies. Amazon Prime and Flipkart Plus exhibited a 74% and 80% retention rate respectively. This goes to show that premium services of the two rivals definitely helps to maintain a higher level of user retention. That said, these users are probably more behaviorally geared towards shopping online anyways. Don’t forget, India is still a market where most people prefer to shop offline when it comes to retail.
A Peek Inside Flipkart’s Supermart Grocery Basket
Supermart is Flipkart’s e-grocery business that offers next day delivery. They work with Ninjacart as a supply chain partner. Recently they just halved their 90-minute delivery system to 45 minutes. The development coincides at a time when other quick commerce firms like Blinkit, Zepto, Swiggy’s Instamart and RIL-backed Dunzo are jostling to deliver a range of products within the 15-20 minute timeframe. Read more here.
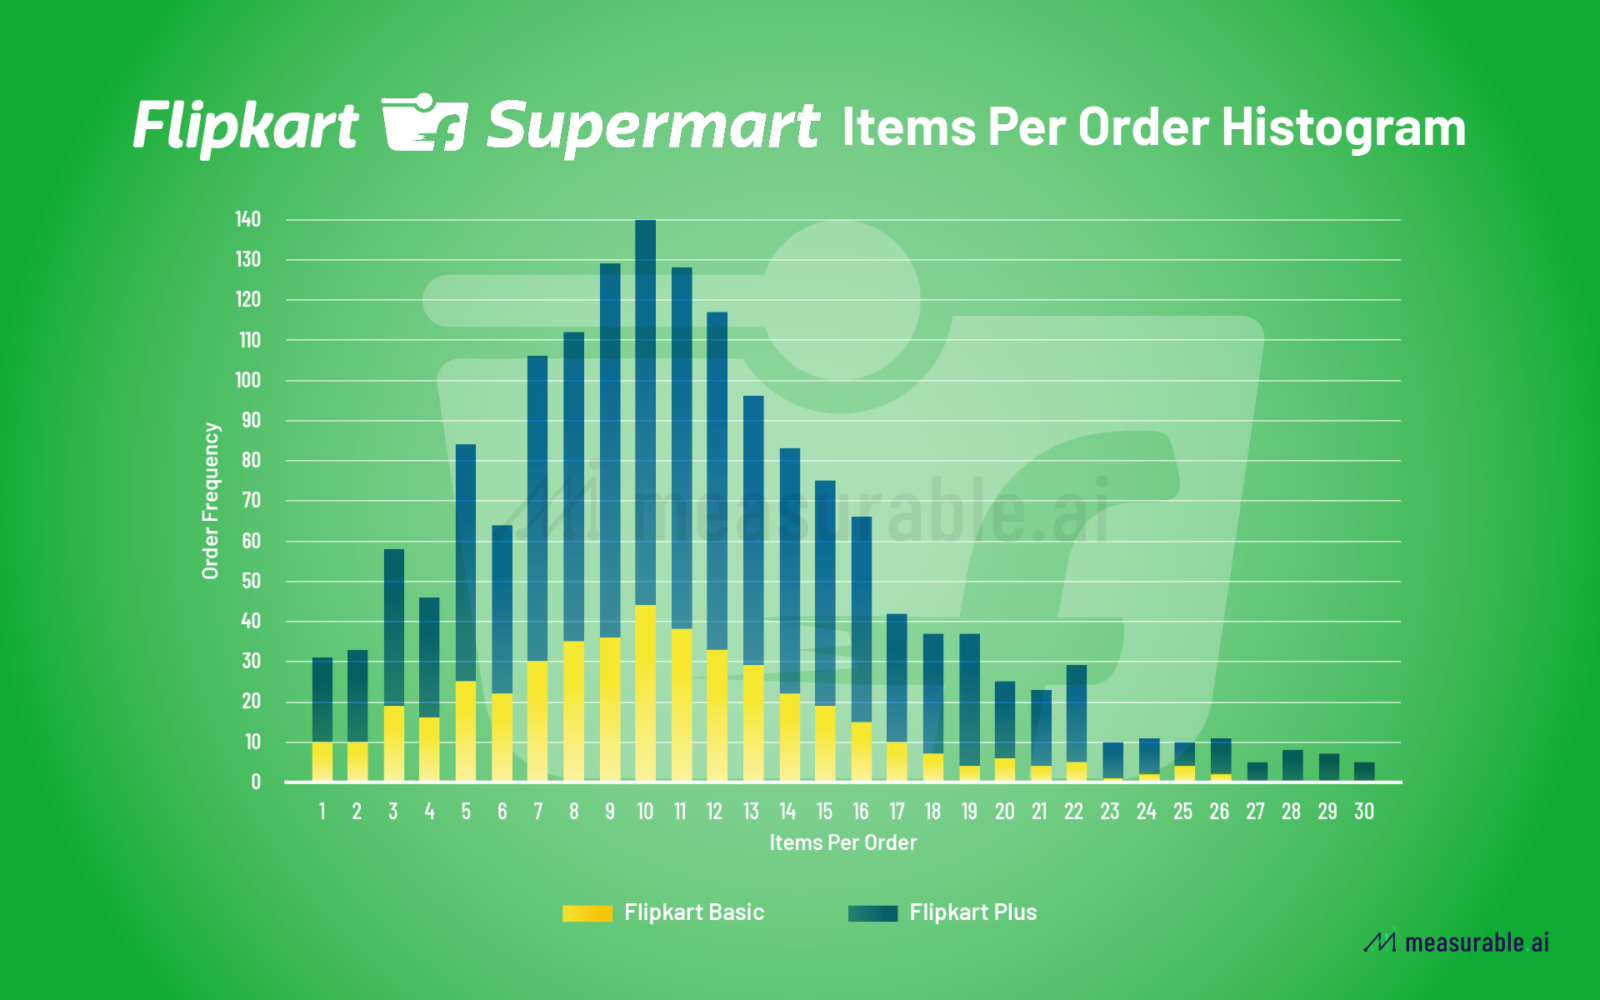
So just how many items does the average Flipkart user checkout in his basket? Taking a look at our e-receipt data panel, Flipkart basic and plus members averaged a mean of 10 items per order. Only Flipkart Plus members tend to order more than 27+ items per basket. Interested to see how much is the average basket order for Flipkart members? Contact us and we will get back to you.
Without getting into too much details of the quick commerce sector, according to Bernstein Research, India is leading other global markets when it comes to quick commerce adoption. Quick commerce penetration as a percentage of online grocery is 13% in the country, while China and Europe are at 7% and 3% respectively.
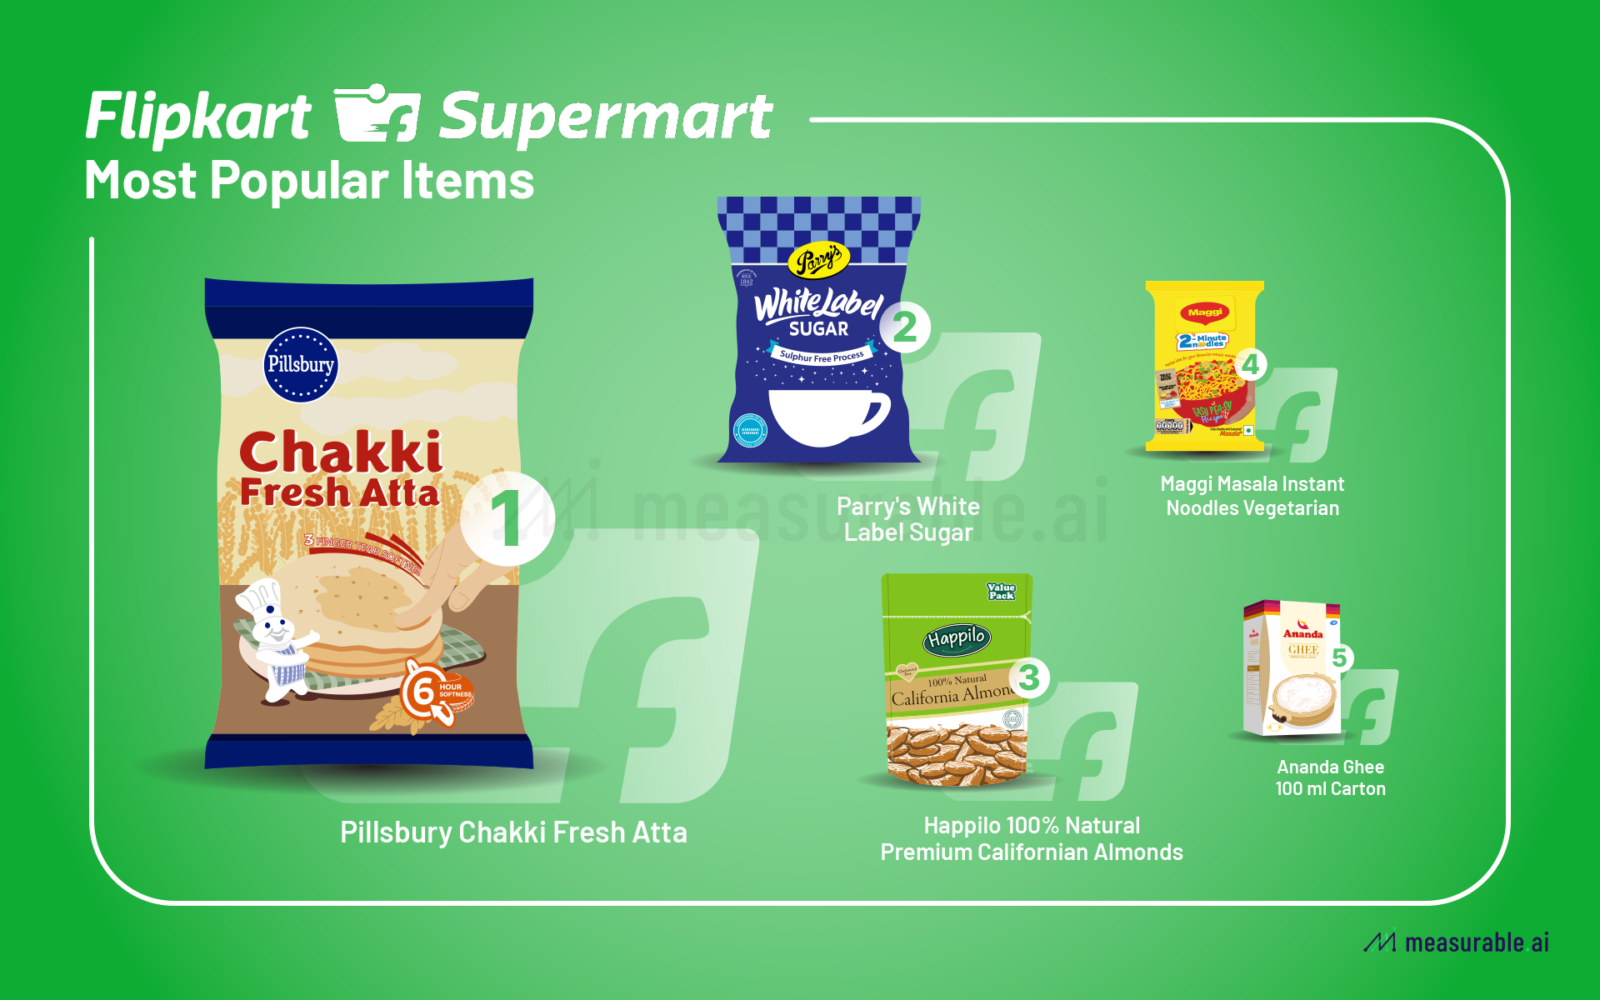
So just for some fun, what are the most popular items that Indian households order on Flipkart? Diving into our e-receipt panel on an item-level, we are able to see that the Pillsbury chakki fresh atta is the most popular item ordered (perhaps Indian households do make a lot of chapati?). Runners up are Parry’s white label sugar, Happilo 100% natural premium Californian almonds, Maggi Masala instant noodles, and then Ananda Ghee used for cooking.
The E-commerce Landscape in India
For those interested in a generic overview of the Indian e-commerce market size, please read on. According to GlobalData’s estimate, India’s e-commerce market doubled between 2017 and 2020 as more consumers are now moving online in line with increasing internet adoption.
With a population of 1.37 billion, India is one of the most inhabited places in the world, second only to China. Yet, relative to its population, internet penetration is not that high, coming in at roughly 45% of the total population.
Thus, when you talk about retail sales in India, the majority of sales is still happening offline due to the low internet penetration rate and the general inclination of the Indian people to shop offline. That said, the e-commerce industry is still massive thanks to the overall population size.
According to India Brand Equity Foundation (‘IBEF’), a Trust established by the Department of Commerce, Ministry of Commerce and Industry, Government of India, India’s e-commerce market is expected to reach US$ 111 billion by 2024 and US$ 200 billion by 2026.
As for turnover, IBEF reports that India’s e-commerce turnover amounted to $50 billion in 2020, positioning India as the eighth-largest market for e-commerce, trailing France and a position ahead of Canada. With an online shopper base of 140 million, India ranks 3rd after the US and China.
In terms of total online Gross Merchandise Value (‘GMV’), according to management consultancy RedSeer, $55 billion in sales were clocked in in 2021, up from $38billion in 2020. Redseer forecasts that the GMV of the e-retail market is likely to increase to $350 billion in 2030.
Much of the growth underpinning the e-commerce sector is an increase in internet and smartphone penetration driven by the “Digital India” programme. As of July 2021, the number of internet connections in India significantly increased to 784.59 million. Out of the total internet connections, ~61% were in urban areas, of which 97% were wireless. According to a report published by IAMAI and Kantar Research, India internet users are expected to reach 900 million by 2025 from ~622 million internet users in 2020, increasing at a CAGR of 45% until 2025.
Interested in the digital sector for India? See our recent article on PhonePe vs Paytm which touches upon this.
About Us
Michelle Tang is a Managing Director at Measurable AI who specialises in digital marketing and strategic partnerships with a passion for data analytics and consumer intelligence. She enjoys research and storytelling with insights derived from Measurable AI’s very own e-receipts data.
You can reach her at [email protected].
Measurable AI is the leading granular e-receipt provider for consumer intelligence in the emerging markets with a core focus in South East Asia, Middle East, India and Latin America.
![]()
Sai Srimoy Sukla
December 19, 2022 at 8:49 PMI am looking for more specific state-wise data. Kindly get in touch if you would like to collaborate.
Repost
January 12, 2023 at 4:37 PMplease write to me at [email protected]