Exploring the Bubble Tea Craze in Hong Kong: Market Trends and Insights
How do different bubble tea brands in Hong Kong fare on the delivery scene?
Every Friday, the team at Measurable AI is rewarded with a bubble tea treat to mark the end of the workweek. Often we are confronted with the paradox of choice. Searching alone on the Deliveroo app in Hong Kong you will see more than 70 bubble tea shops. Same goes for Foodpanda. As a bubble tea lover since childhood days, this prompted my curiosity to discover which bubble tea shops fared the best in terms of delivery orders. And so I act on this inquisitive boba thirst and start digging into our datasets to see what insights I can unearth.
First, a brief history. Bubble Tea was created in the 1980s in Taiwan and quickly became a popular street food item. Hong Kong’s first sip of bubble tea was introduced in 1994 by St. Alp’s Tea House (remember the big foot logo?). Fast forward to 2023. Nowadays, most bubble tea is sold out of street side stalls or takeaway deliveries with a plethora of brand names and options to choose from.
Without further ado, here are my findings from analysing Measurable AI’s Hong Kong food delivery datasets for Foodpanda and Deliveroo for the quarters 4Q22 and 1Q23.
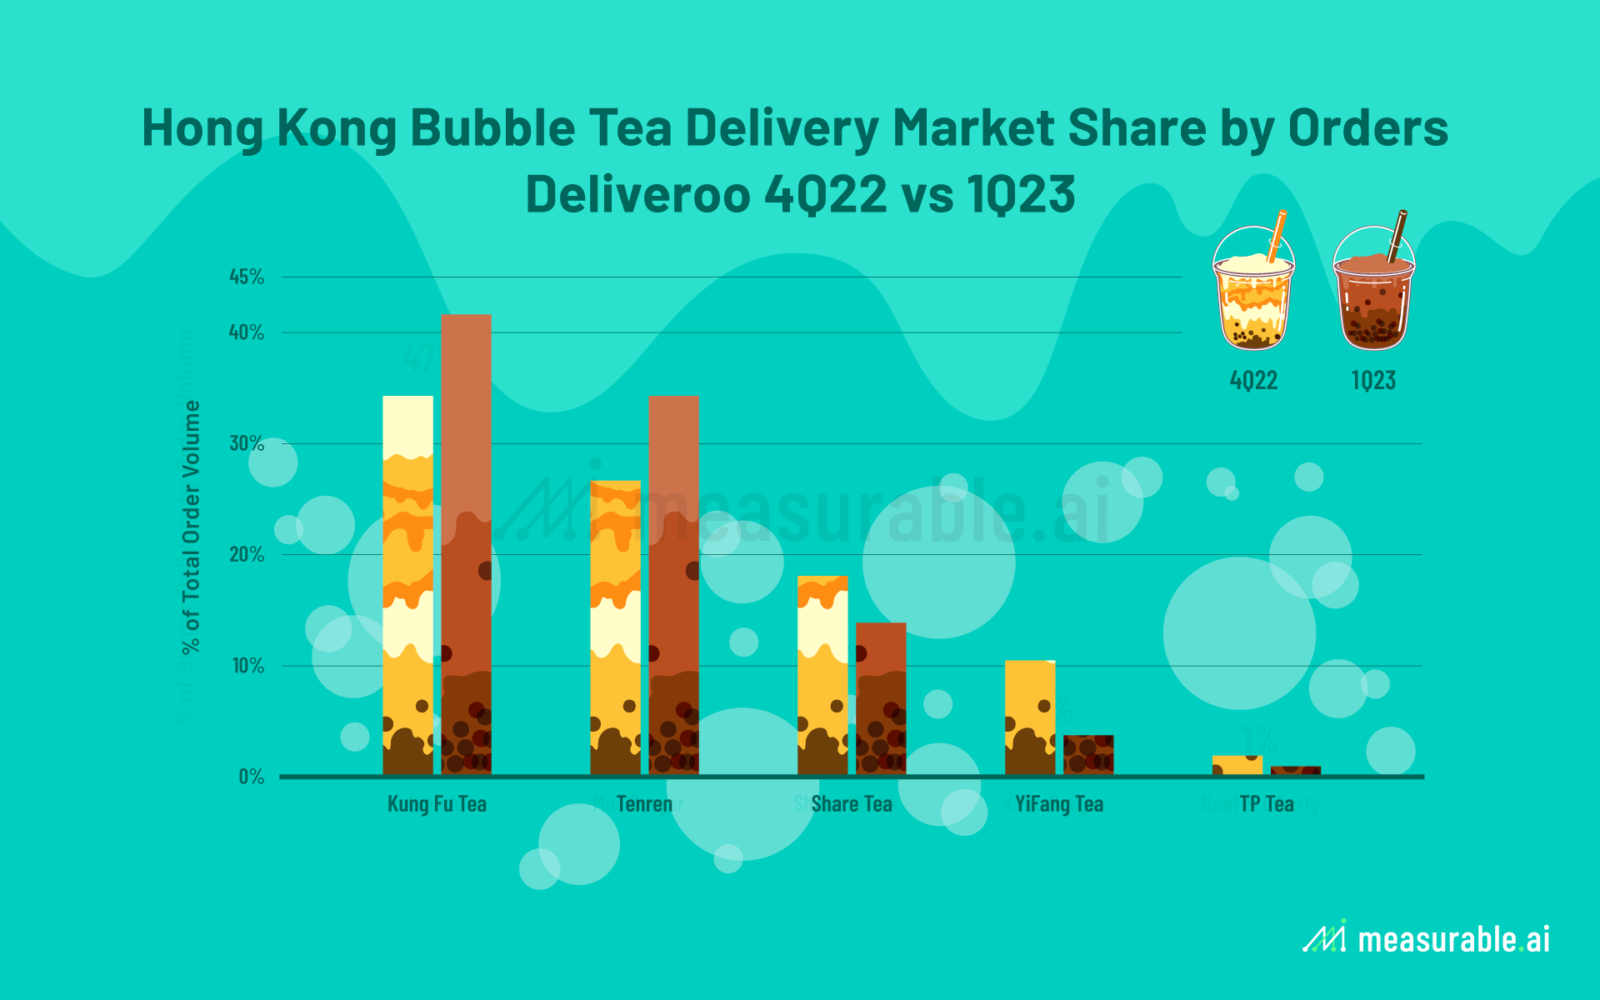
Hong Kong Bubble Tea Delivery Market Share by Orders
KungFu Tea Leading the Pack on Both Delivery Platforms
The clear winner in terms of number of bubble tea transactions ordered and delivered on Deliveroo is Kung Fu Tea (手作功夫茶). Accounting for 34% of all bubble tea delivery transactions in 4Q22, it has gained more traction in 1Q23 with 42% of market share by order volume. TenRen tea comes in second, accounting for 27% of market share in 4Q22 and then growing to 34% in 1Q23. Share Tea, on the other hand, comes in third but seems to be losing market share when it comes to number of orders, falling from 18% to 14% from 4Q22 to 1Q23 respectively. YiFang Fruit Tea (一芳台灣水果茶) also suffered a drop in number of delivery orders, from 10% to 4%.
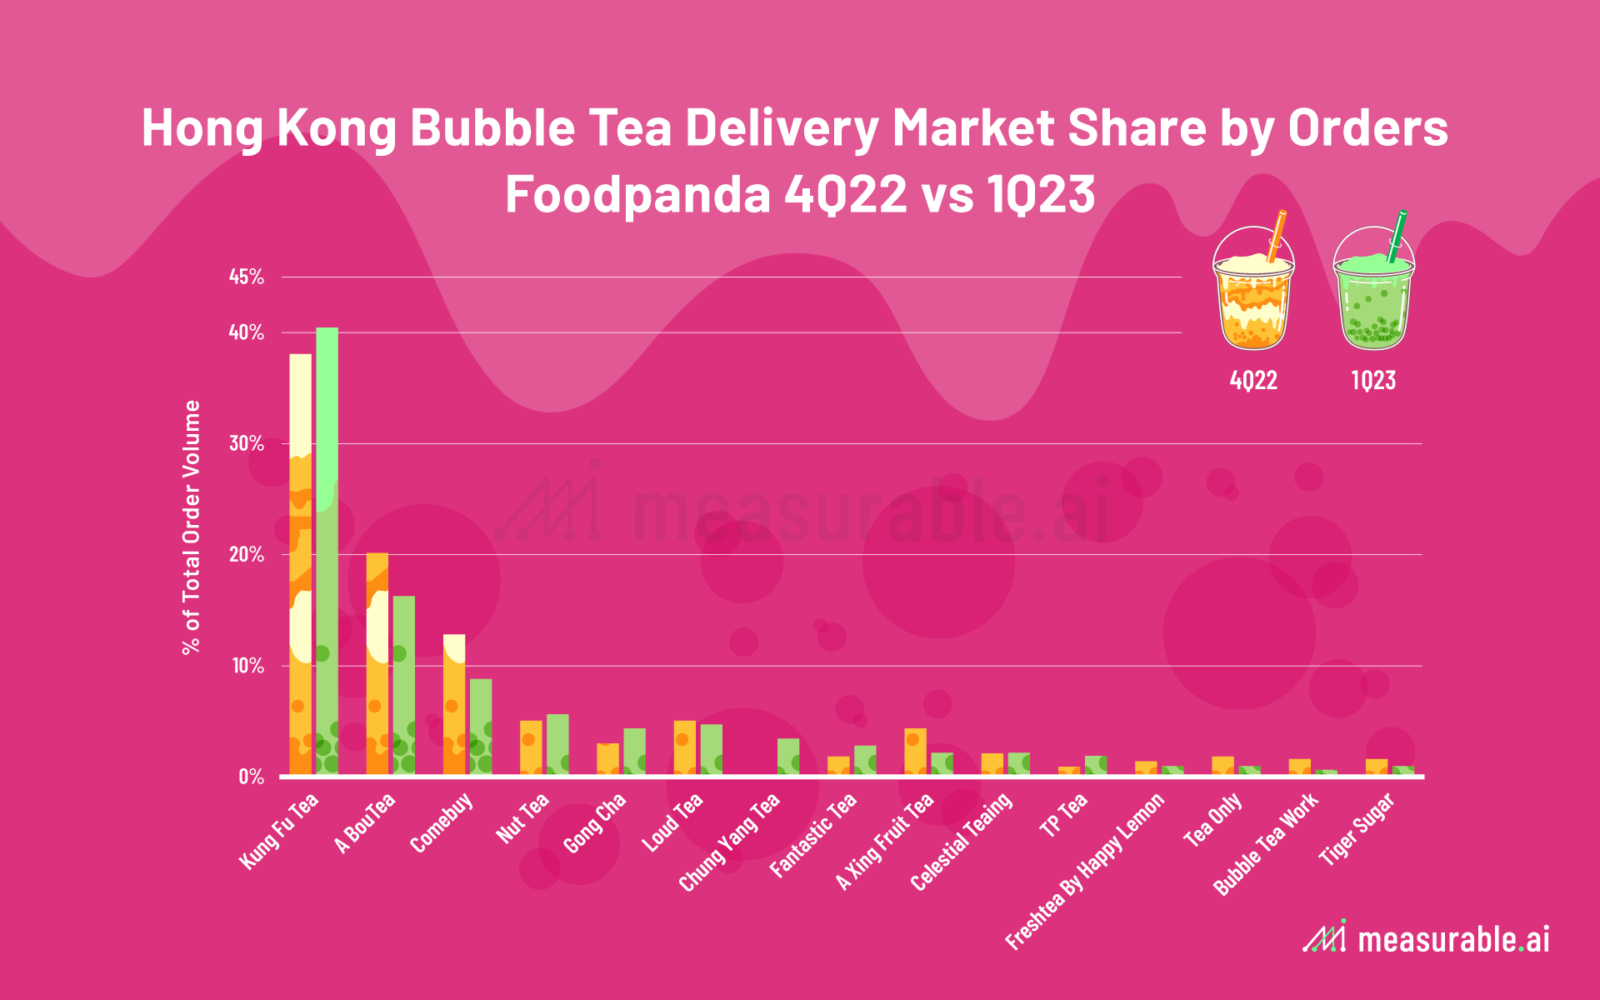
Turning to Foodpanda, the clear leader here when it comes to market share by number of delivery orders is Kung Fu Tea, accounting for 38% and 40% of total bubble tea delivered for 4Q22 and 1Q23 respectively. Runners up is A BouTea, accounting for 20% of market share in 4Q22 before dropping to 16% in 1Q23. In third place we have Comebuy, who also experienced a drop in delivery orders from 13% in 4Q22 to 9% in 1Q23.
Average Spend per Bubble Tea Delivery Order in Hong Kong
The average spend per transaction across the board on bubble tea deliveries on Foodpanda amounted to HKD139 for 4Q22 and HK126 for 1Q23. For Deliveroo, the average spend per delivery order on bubble tea is ~4.3% and ~36.5% higher than Foodpanda’s for 4Q22 and 1Q23 respectively, coming in at HKD145 and HKD172.
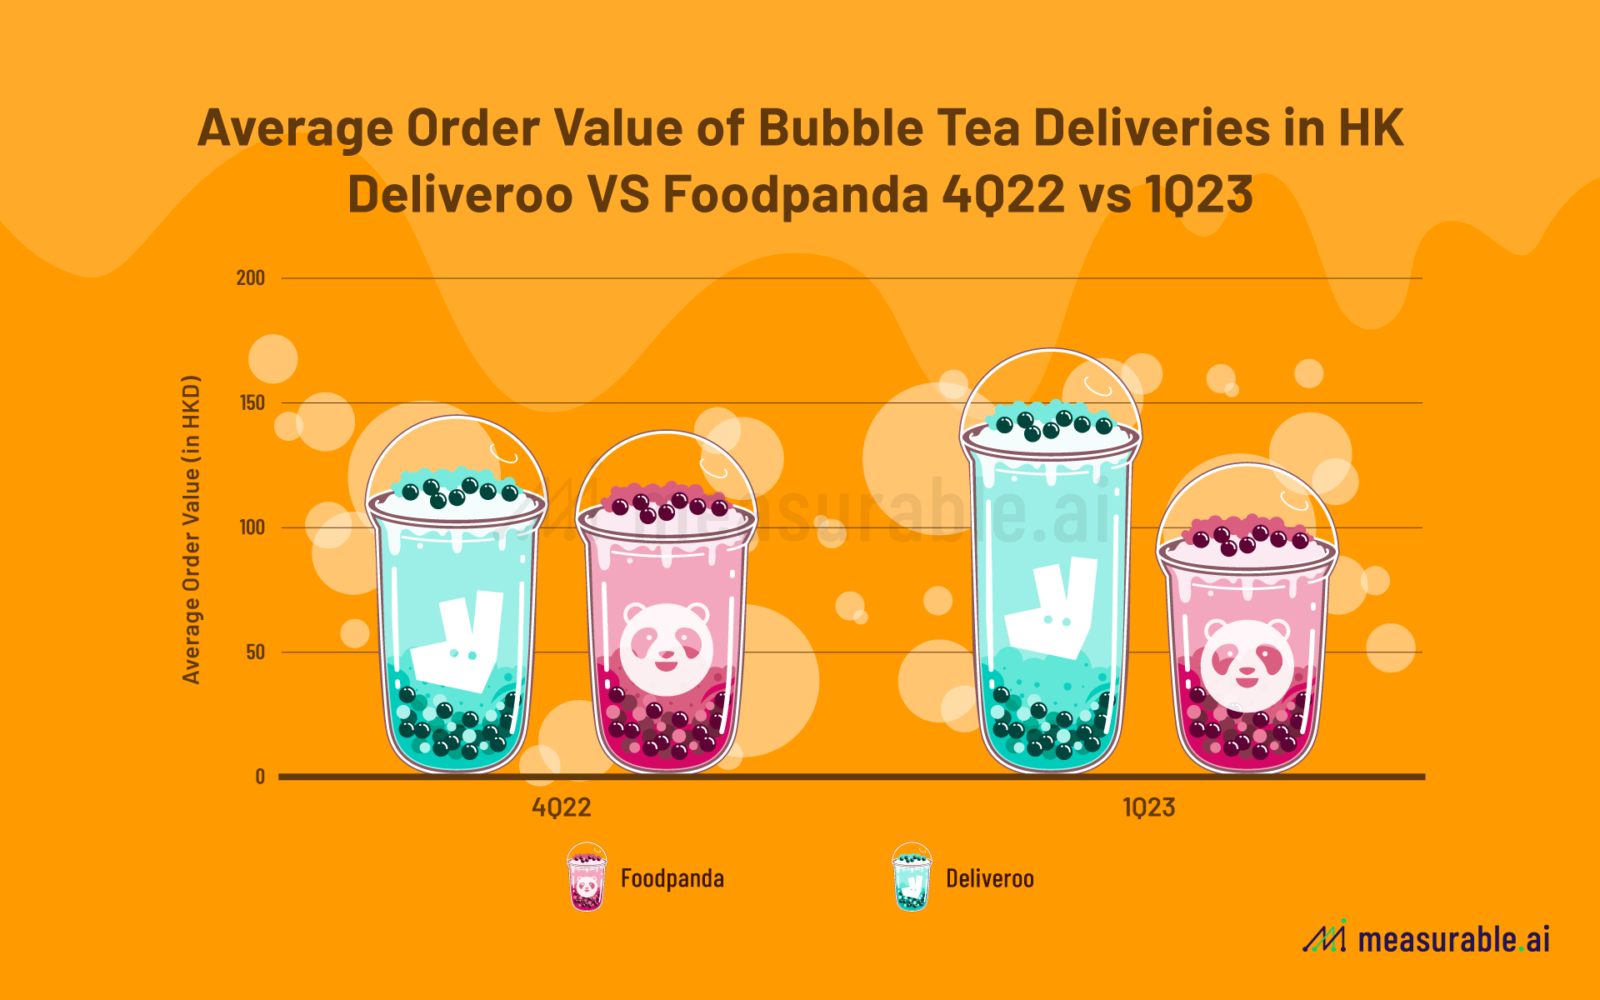
From our e-receipt dataset, Deliveroo seems to have enjoyed a ~19% increase in number of bubble tea delivery orders from 4Q22 to 1Q23 while Foodpanda suffered a ~9% QoQ decline.
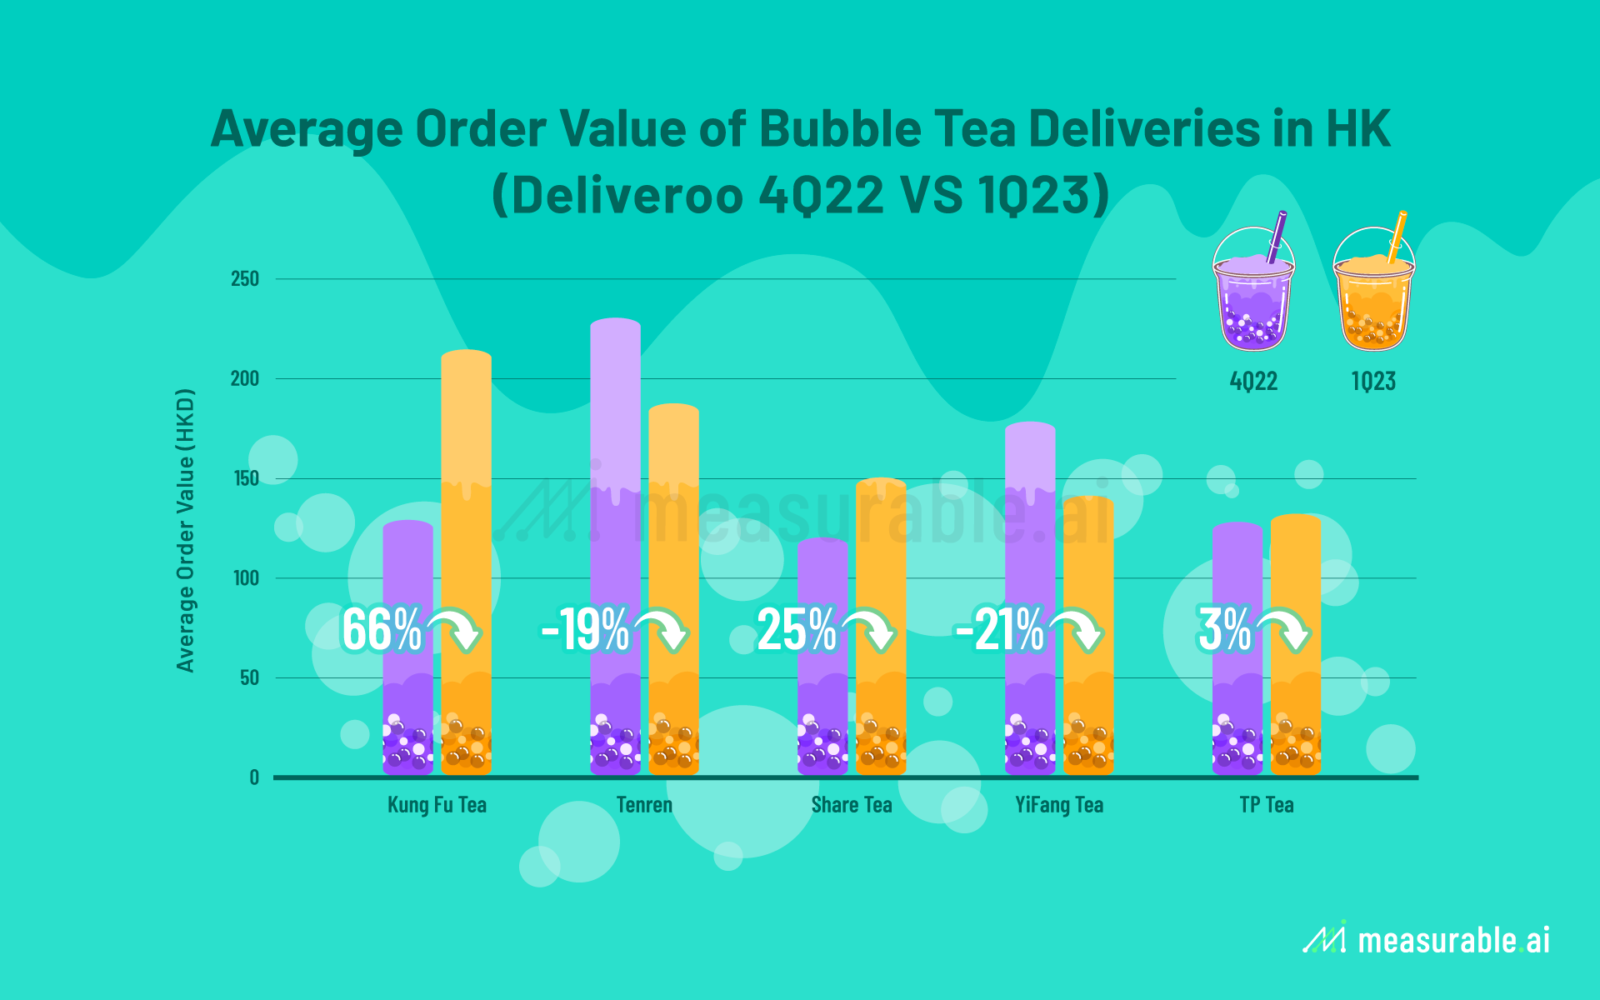
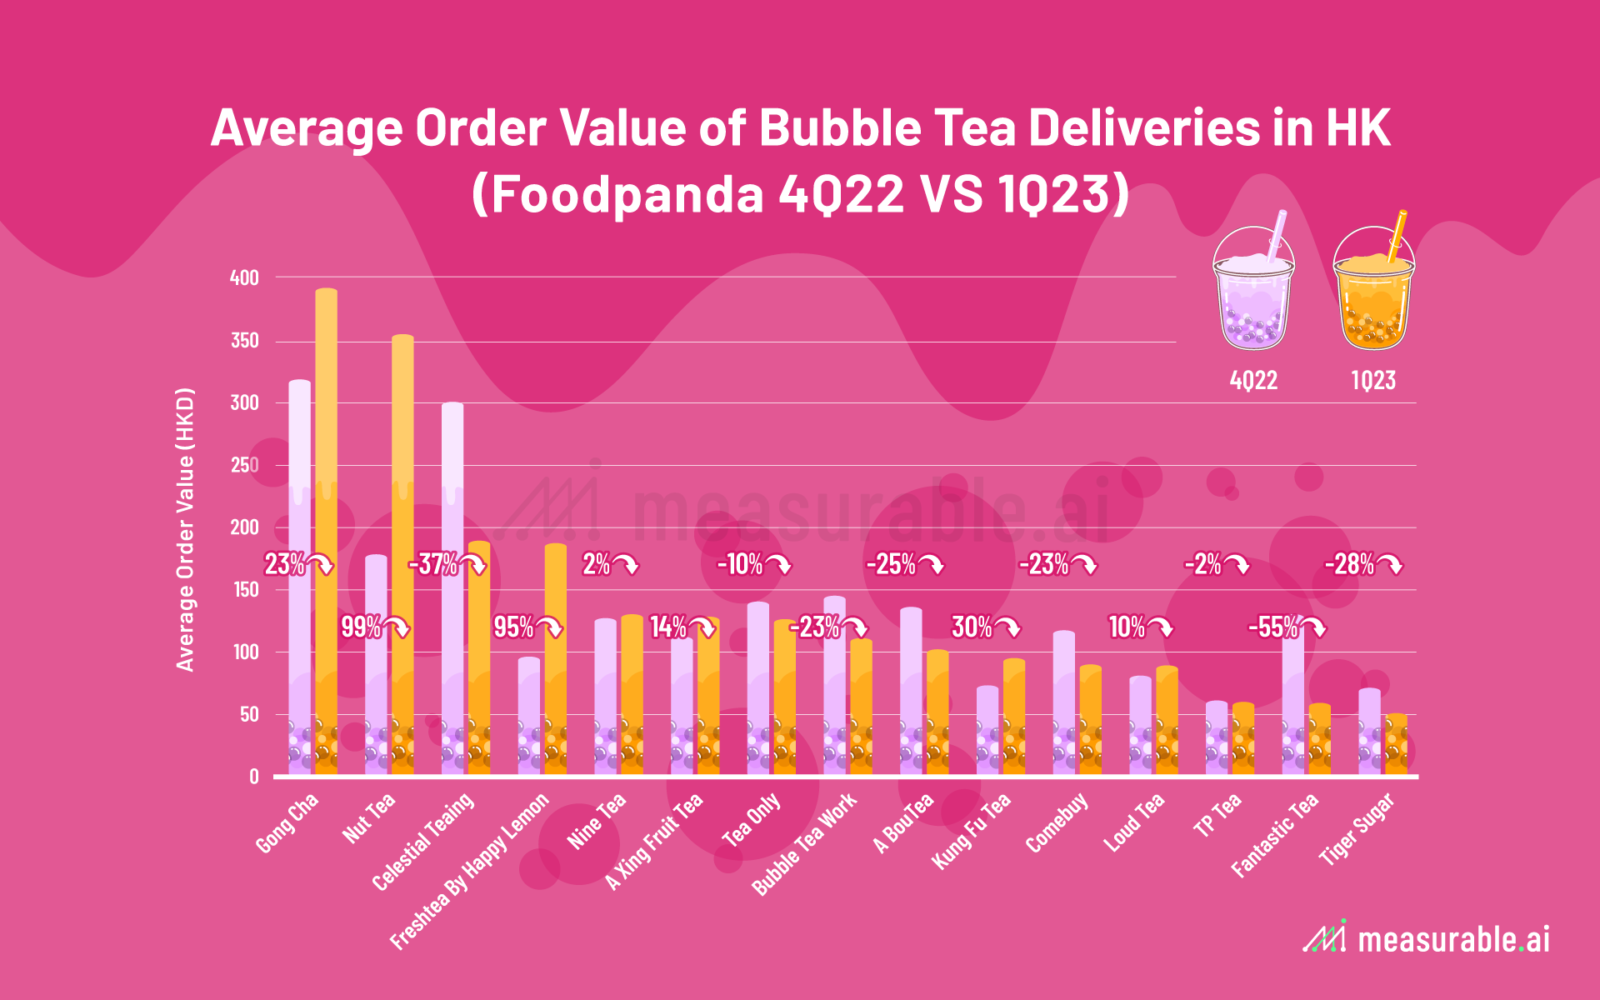
Which Bubble Tea Brand Has the Highest Average Order Value Per Delivery Transaction?
Acknowledging that Deliveroo receives a bigger dollar amount with each delivery transaction, how about the bubble tea brands themselves? Curious to see which one is enjoying the highest average order value per delivery, I pry again at our datasets to see what insights I can gather.
For bubble tea deliveries on Deliveroo, the winner goes to Kung Fu Tea and runners up position to Tenren Tea, which averaged at HKD214 and HKD187 respectively for 1Q23.
Looking at our Foodpanda e-receipt dataset, for 1Q23, Gongcha holds the number one position when it comes to the highest average spend per delivery at HKD391 per receipt. Second place goes to Nut Tea (HKD354) and then Celestial Teaing (HKD189). For 4Q22, Gong Cha also held the winning spot, averaging HKD318 per delivery receipt with Celestial Teaing next in line at HKD300 per delivery receipt.
About Measurable AI
At Measurable AI, we build and own a unique consumer panel and are the largest transactional email receipt data provider for the emerging markets. We are well regarded for our comprehensive alternative dataset across the digital economy. Check our Latest 2019-2022 Food Delivery Annual Report.
About the Author
Michelle Tang is passionate about food and cooking. She loves finding answers and storytelling with insights derived from datasets. If you would like to dive deeper into our fast food delivery datasets or wish to see a sample, you can reach her at [email protected].
*The Content is for informational purposes only, you should not construe any such information or other material as investment advice. Prior written consent is needed for any form of republication, modification, repost or distribution of the contents.
![]()