The Roller Coaster Goes On: Food-Delivery Companies in Asia (II)
In a former report, we used Measurable AI’s unique e-receipts data to look at the food delivery industry in APAC in the early months of covid-19, and saw a huge surge in food delivery volume. After six months, the pandemic is still not over, and so is the competition among the food delivery companies.
Based on one year of historical data in 2020, Measurable AI presents the second part of the food delivery industry research, covering market share, user behavior, and pricing strategy.
1. Who is winning the “hunger game”
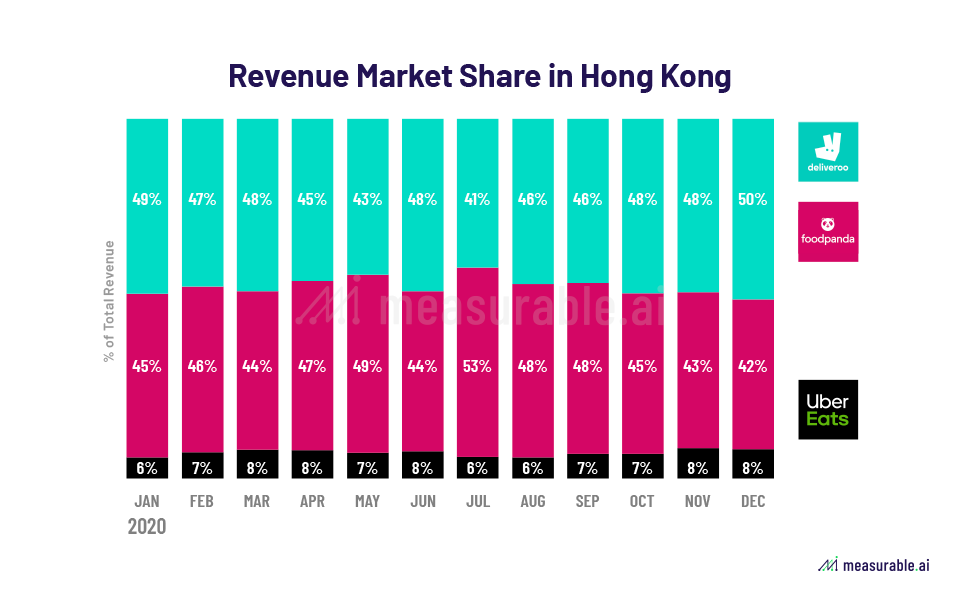
Measurable AI’s e-receipts data reveals major players’ market share change across the whole year of 2020.
Competition between Deliveroo and Foodpanda remains fierce in Hong Kong. Deliveroo was leading in Q1 and Q4 while Foodpanda performed better in the second half of the year. In contrast, UberEats occupies a smaller market share in Hong Kong, with less or equal to 8%.
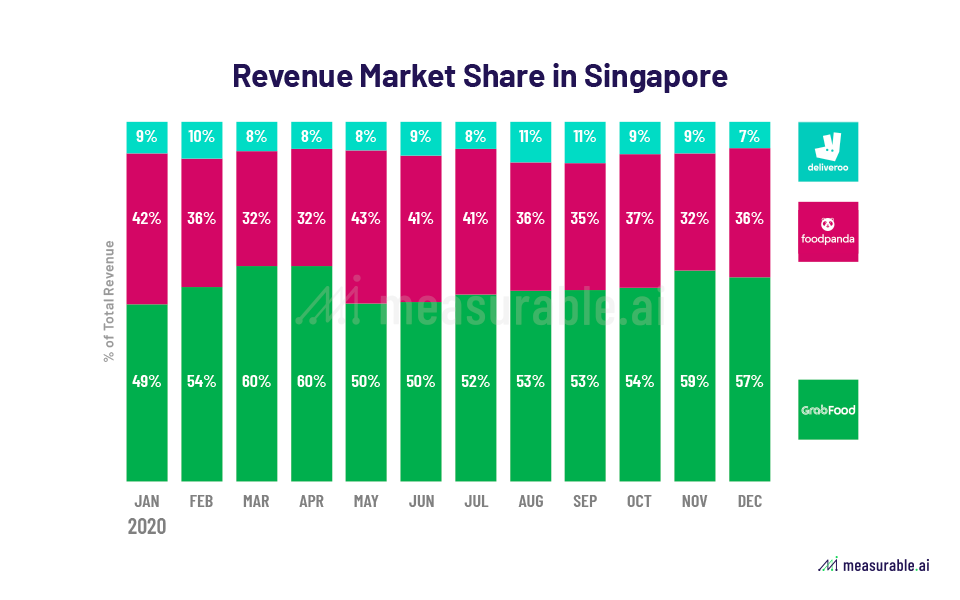
GrabFood obtained the highest share of wallet (SOW) in Singapore in 2020, reaching 60% of the market share in March and April. Though facing a fierce chase of Foodpanda, it’s above where it was at the beginning of 2020. Deliveroo’s situation in Singapore is a bit similar to UberEats in Hong Kong, with a small market share of close to 8%. (*Go-Jek is not included in this dataset)
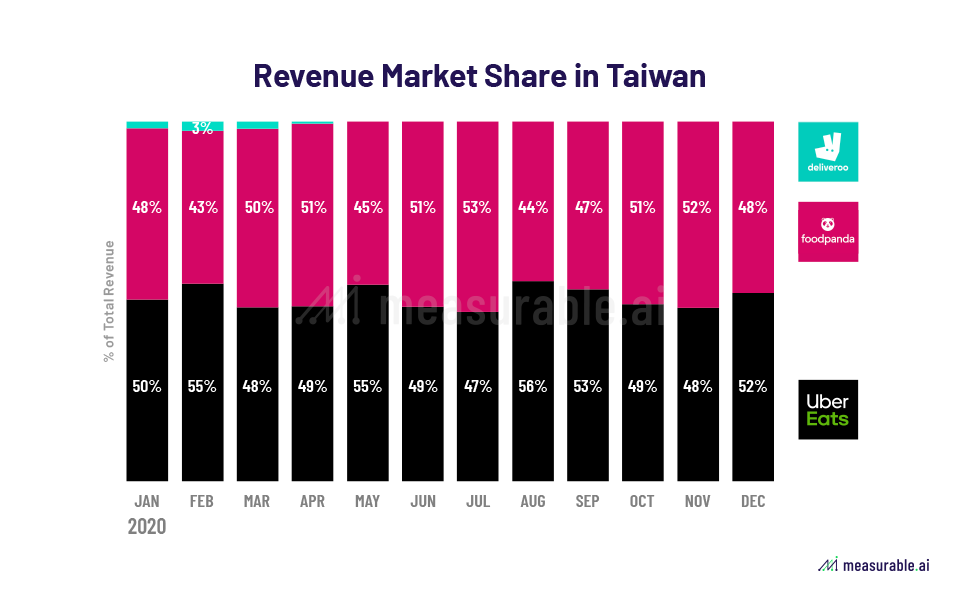
In Taiwan, Foodpanda and UberEats share the market. Foodpanda led slightly with a percentage of more than 50% during Q1-Q3. However, Foodpanda caught up in the last quarter with a small advantage (around 50.1% versus 49.9%). What is consistent with the fact is Deliveroo quit in April and our data catches this event.
2. Customer Behaviour: Whales Versus Frequent Buyers
We mainly look at the customer behaviour on these major food delivery platforms through their average order price, price distribution, and order volume. According to Measurable AI’s e-receipts data, customers’ behaviour varies a lot across these major food delivery companies. It is noted that in all regions, Deliveroo customers are the “whale spenders”.
Hong Kong:
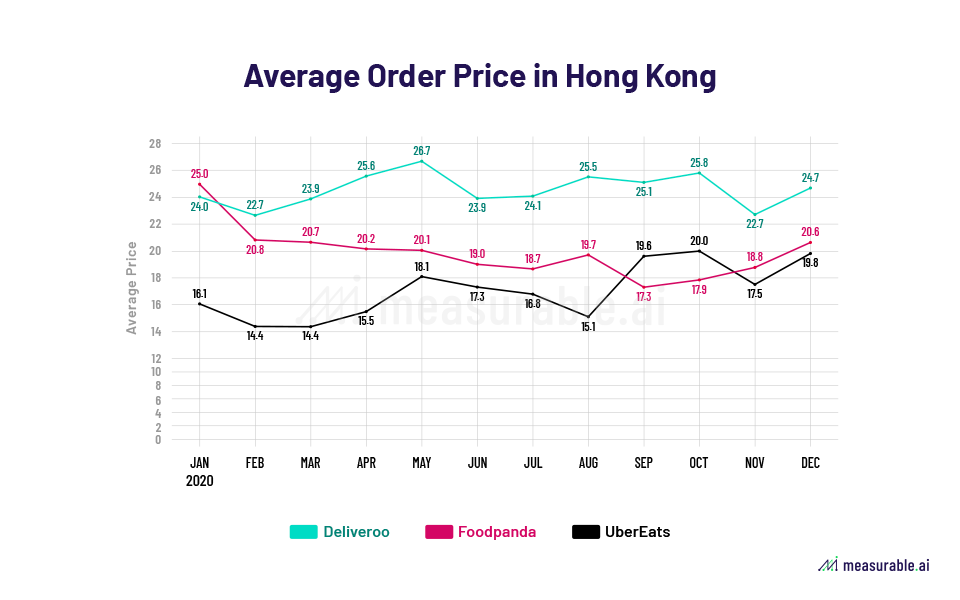
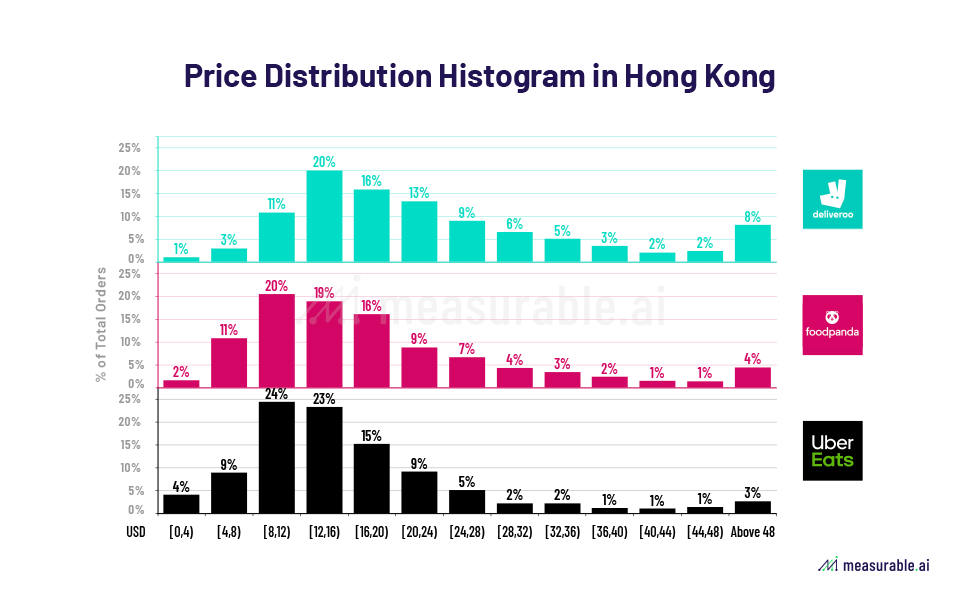
In Hong Kong, we set the price interval as 4 USD based on our granular e-receipts data. From the price line chart and distribution histogram, it is seen that:
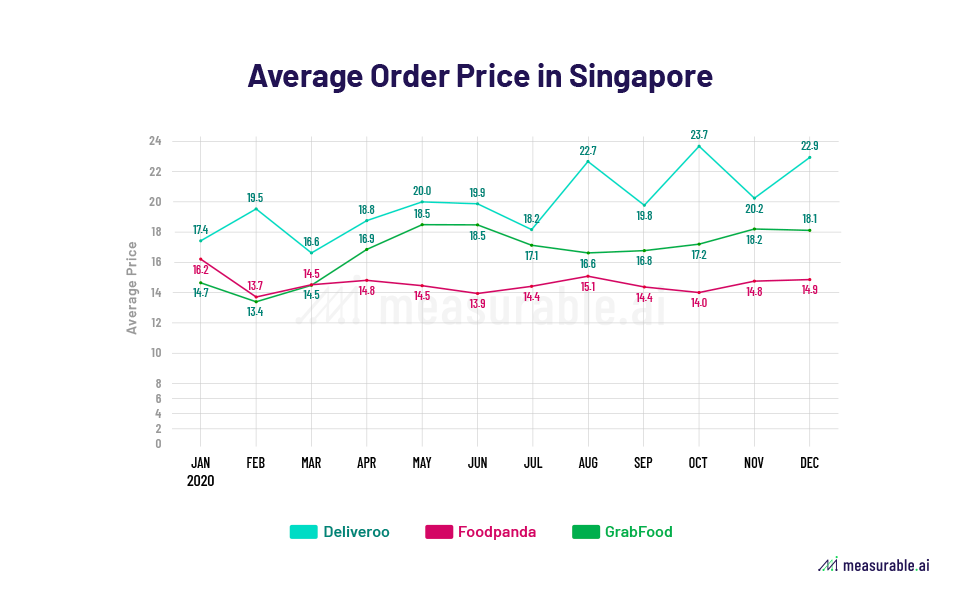
- The average price: Deliveroo > Foodpanda > UberEats
- The average price of UberEats orders gradually increases over time, while that of Foodpanda decreases. They came to a similar level at the end of 2020
- Most customers spend 8-20 USD on each order
- Deliveroo customers own the highest consumer price and the highest ratio of orders above 48 USD
- Most UberEats customers’ orders fall into the interval of [8,16), while more Foodpanda Customers spend around [16, 40), leading to a higher average price of Foodpanda
Singapore:
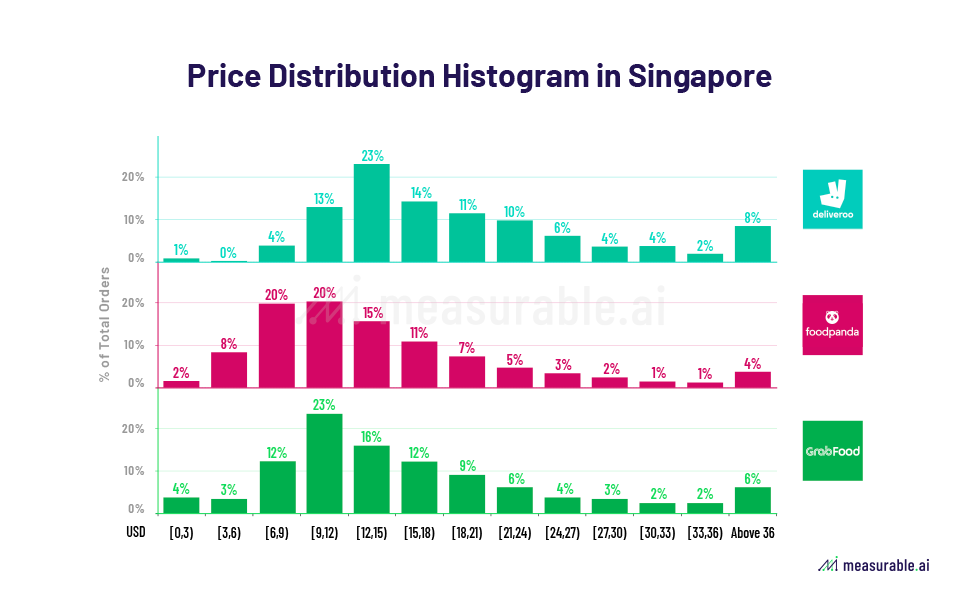
In Singapore, frequent buyers definitely outnumbered the whale spenders. According to our e-receipts data, we set the price interval as 3 USD.
- The average price: Deliveroo > GrabFood > Foodpanda
- Order Price from Deliveroo are even higher in the latter half of 2020
- Order price of Grab saw a big jump from February to May, and gradually reach a stable level
- Three companies take different pricing strategies
- Deliveroo takes the high-end route, with most of its order price lies in the interval of [12,15) and 8% of its orders are above 36 USD
- Order price of GrabFood mostly lies in the interval of [9,15], while Foodpanda in the interval of [6,12)
Taiwan:
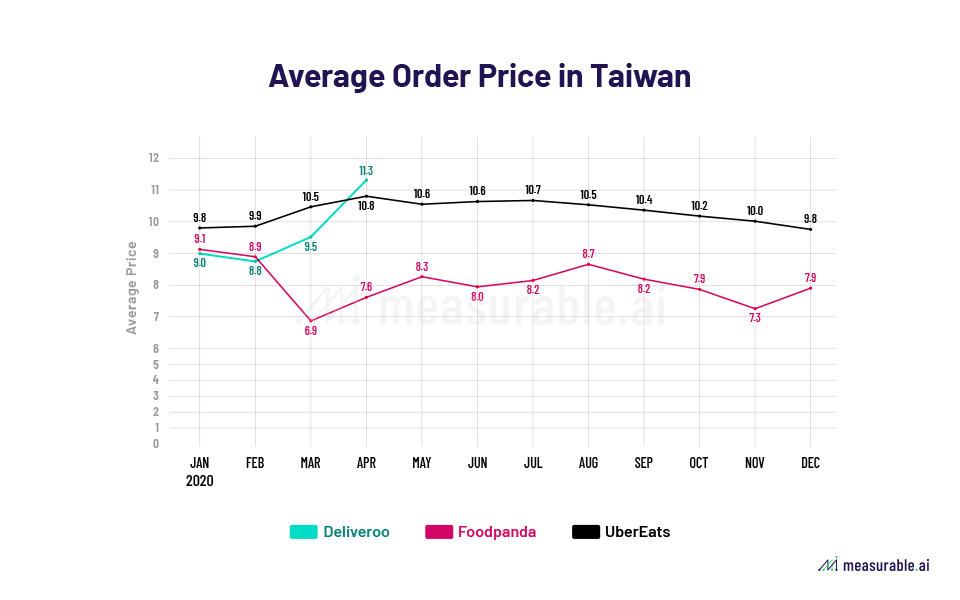
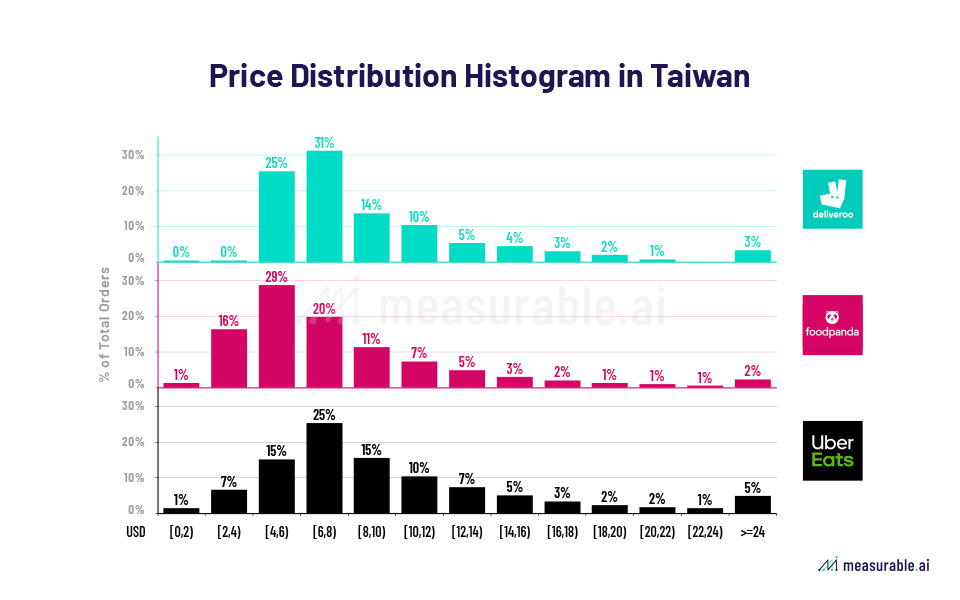
In Taiwan, we set the price interval as 2 USD, and the findings are as follows:
- The average price: UberEats>Deliveroo > Foodpanda
- UberEats: Throughout the year, the order price is relatively stable for UberEats at a higher level of around 10.3 USD on average.
- Foodpanda: In March, the order price decreased significantly but rebound in the next two months.
- In the low-price-interval of [0,4): Foodpanda (17.7%) > UberEats (8%) > Deliveroo (0.8%).
- The price peak of Foodpanda lies in the interval of [4,6), while this data is [6,8) for the other two companies.
- Deliveroo: The average order price is highly concentrated in the interval of [4,8), with a total share of around 56%
- UberEats has the largest ratio in orders above 8 USD, which is relatively high in the Taiwan market.
3. Capturing the Delivery Fee Strategy
Our e-receipts data reveals the competition among these food delivery companies on the delivery fees. Delivery fee and order volume are negatively related both horizontally and vertically.
Hong Kong:
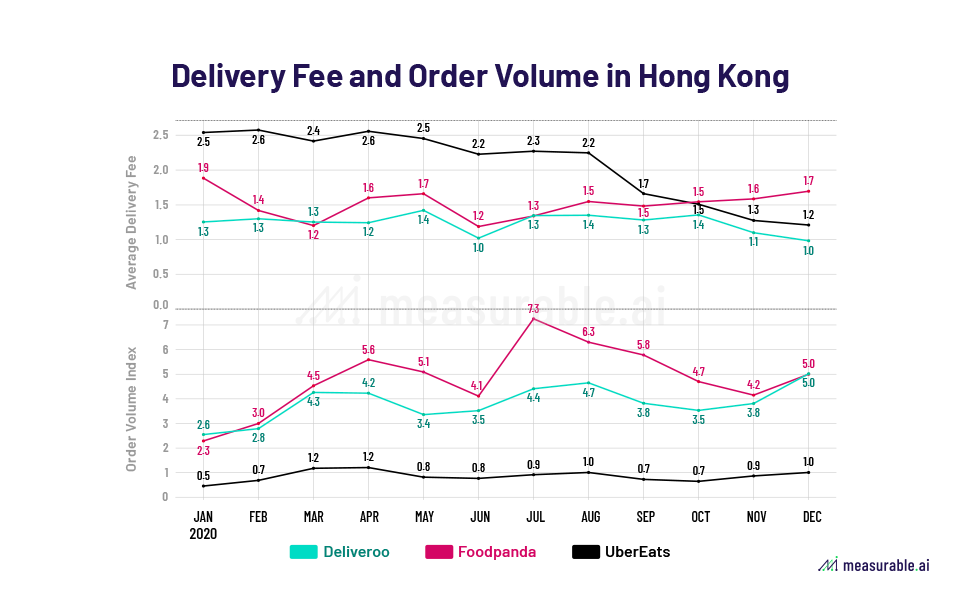
All companies have tried to cut the delivery fee in different regions, among which UberEats in Hong Kong did make some big moves. According to the graph below for the Hong Kong market, the delivery fees of UberEats keep dropping along the way in 2020. As time goes on, delivery fees decrease when order volume increases. The order volume of Foodpanda reached the peak in July, which is also consistent with the coronavirus peak in Hong Kong.
- Delivery fee: UberEats > Deliveroo > Foodpanda
- Order volume: Foodpanda > Deliveroo > UberEats
Singapore:
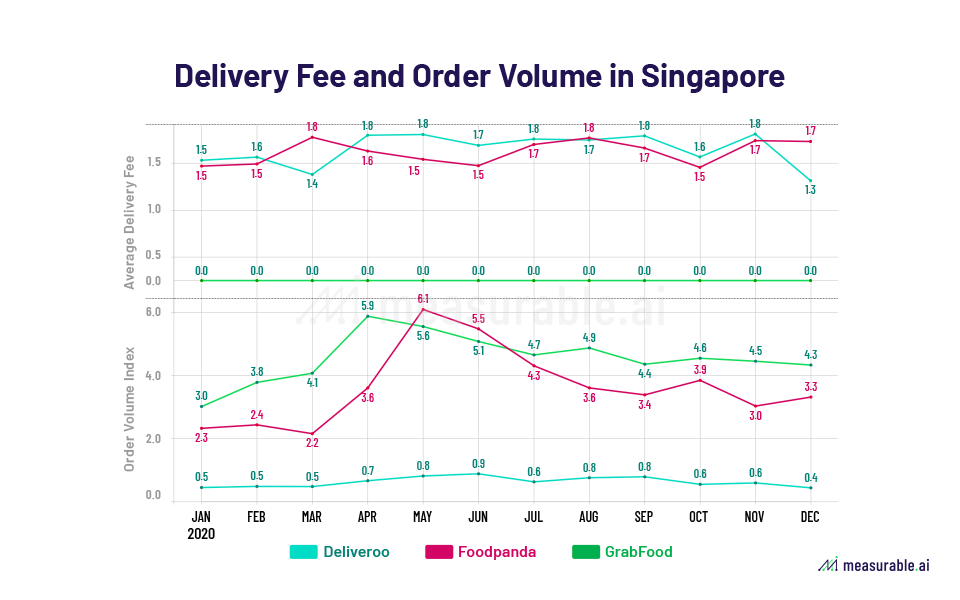
In Singapore, the order volume of GrabFood and Foodpanda both reached a peak in Q2, while Deliveroo remained unchanged. Surprisingly in May and June, Foodpanda surpassed GrabFood in order volume.
- Delivery fee: Deliveroo > Foodpanda > GrabFood = 0
- Order volume: GrabFood > Foodpanda > Deliveroo
Taiwan:
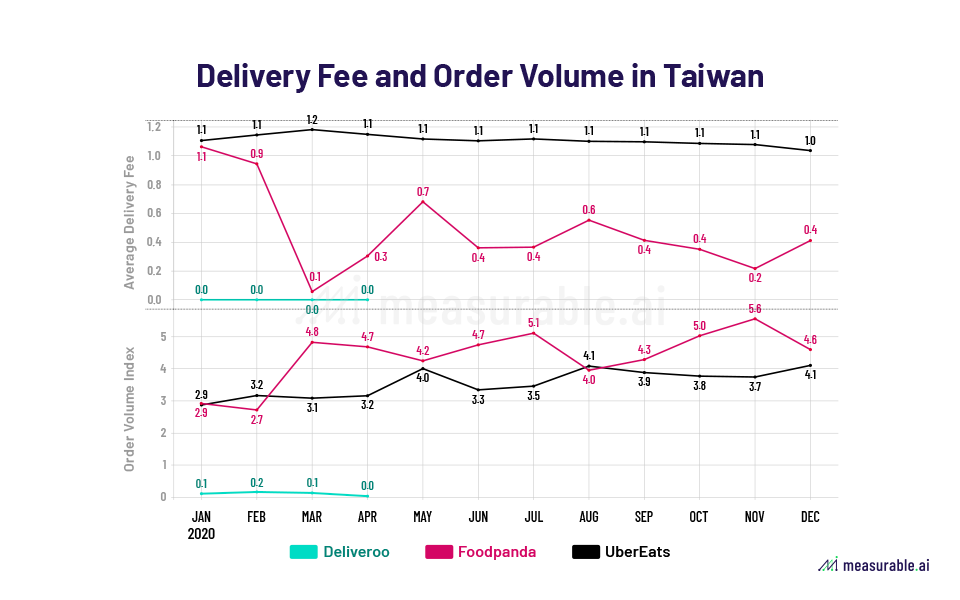
UberEats: The average delivery fee of UberEats was stable at the level of 1.1 USD/order and their order volume steadily increased in 2020.
In March, the delivery fee of Foodpanda has seen a sharp decline, dropping from 0.9 USD to 0.1 USD on average, resulting in the growth of order volume at a growth rate of 77.4%. Every time the delivery fee dropped to the bottom, the order volume hit the peak and vice versa.
- Delivery fee: UberEats > Foodpanda > Deliveroo
- Order volume: Foodpanda > UberEats > Deliveroo
Talk to us for more transactional datasets on food delivery industries in more markets.
Read: The Roller Coaster Goes On: Food-Delivery Companies in Asia (I)
ABOUT US
Measurable AI provides actionable consumer insights based on millions of consumers’ transactional records for the emerging markets.
Jocelyn Yang is a data analyst with a background in economics and blockchain. She enjoys using Measurable AI’s unique transactional e-receipts data to generate consumer insights for the emerging markets.
*The Content is for informational purposes only, you should not construe any such information or other material as investment advice
![]()
The Roller Coaster of Food-Delivery Companies in Asia (I) – Data Insights – Measurable AI
February 19, 2021 at 7:10 PM[…] Read The Roller Coaster Goes On: Food-Delivery Companies in Asia (II) […]