Watch Out! Keeta’s Rapid Rise in Hong Kong
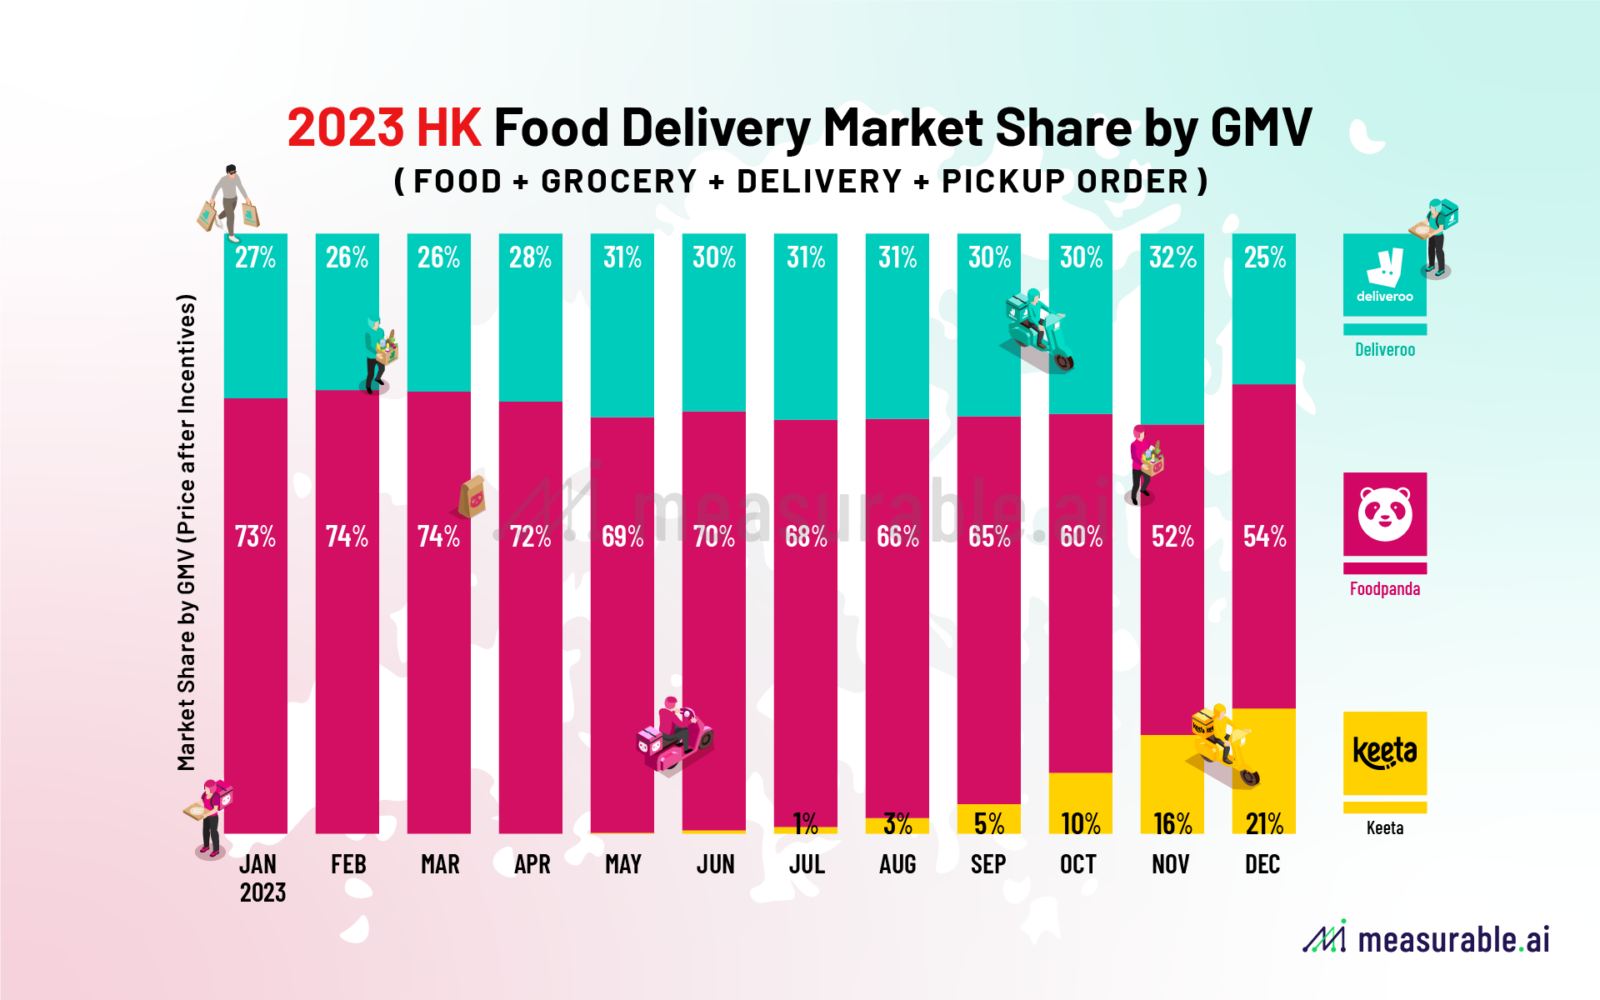
The entry of Keeta, sister app of Meituan (3690.HK) has intensified the already fierce competition in Hong Kong’s food delivery market. In just six months, Keeta has significantly marked its presence in Hong Kong, claiming a prominent market share at around 21% by GMV as of December 2023. However, this raises a familiar question faced by many in the food delivery industry: how to sustain the aggressive growth strategies fueled by high incentives?
At Measurable AI, we’ve been closely monitoring Keeta’s trajectory in Hong Kong since its debut(read about Keeta’s first month), and we’re here to follow up with more details of this competitive market using our proprietary transactional e-receipts data.
Hong Kong food delivery market share: Foodpanda vs Deliveroo vs Keeta
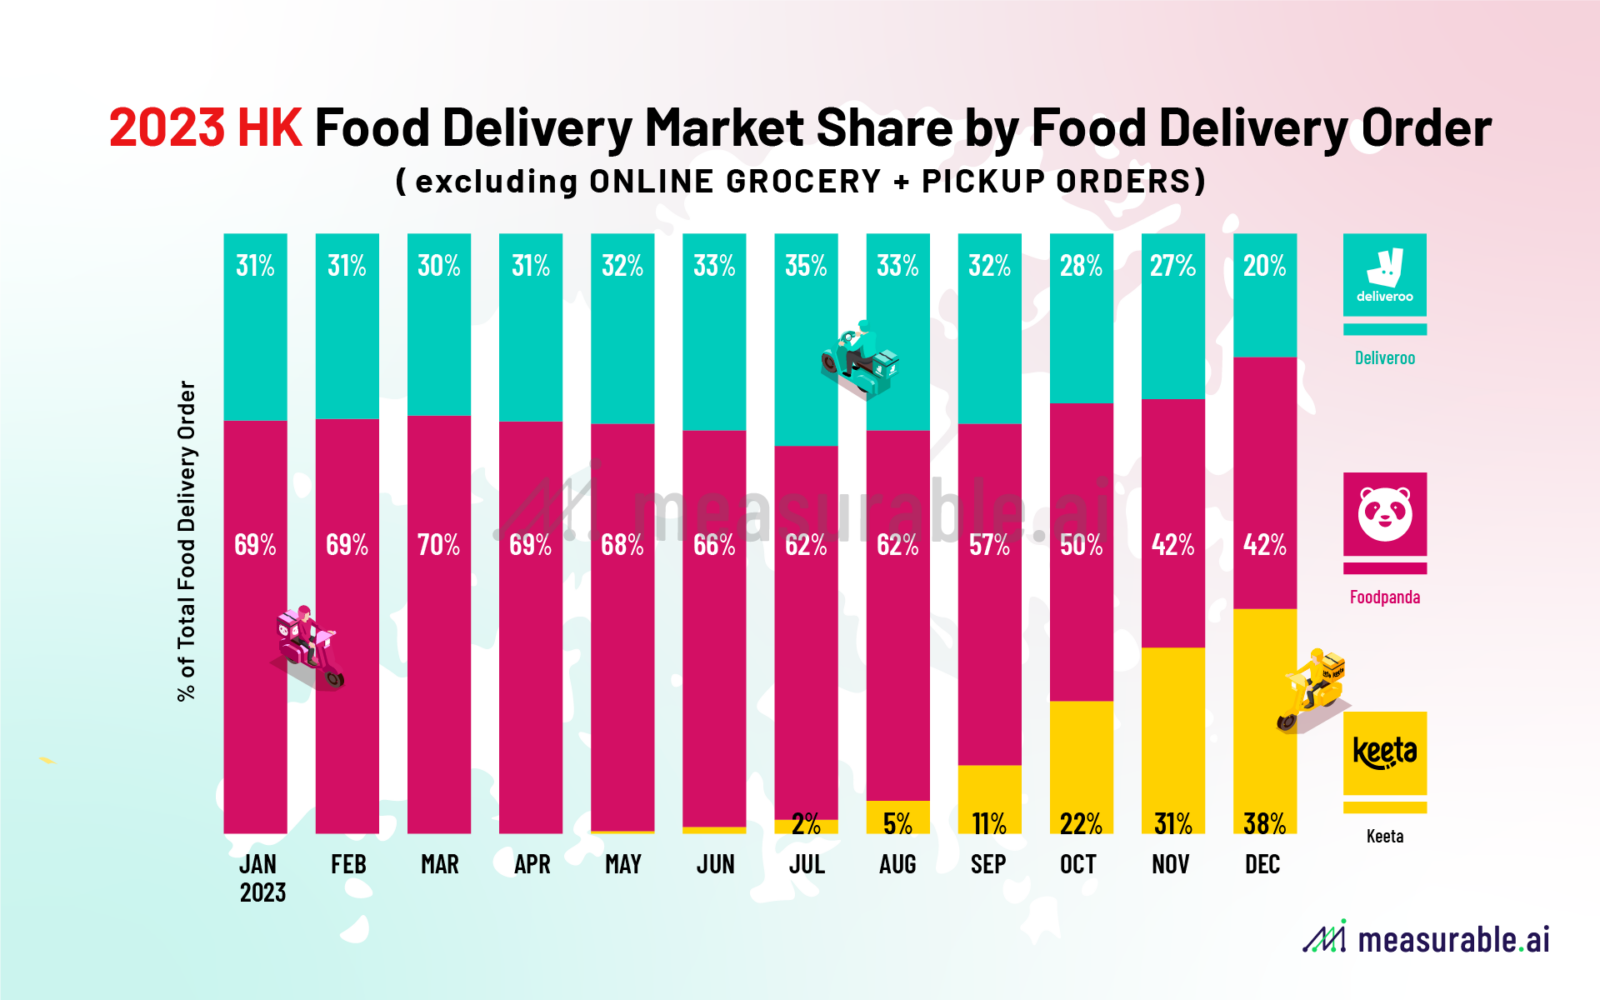
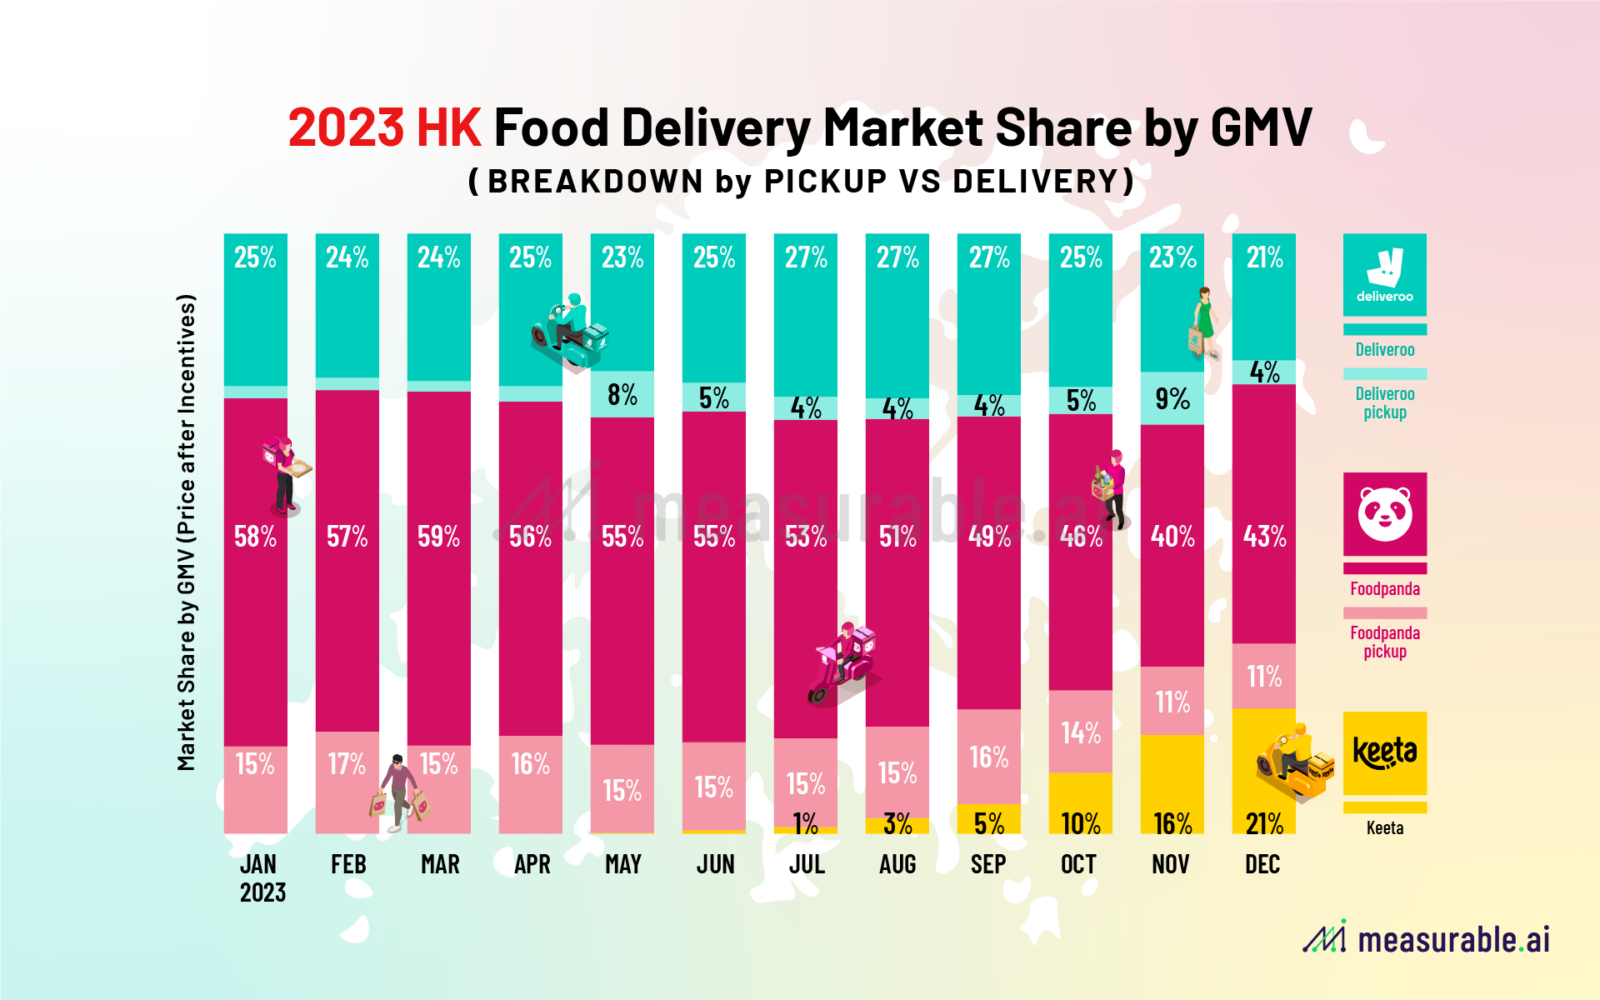
Keeta owns a significant market share in terms of order volume by Q4 2023, but a slightly smaller share by Gross Merchandise Value (GMV), owing to its relatively lower Average Order Value (AOV) .
As a new player, Keeta initially captured less than 5% of the market share during its first three months—a period in which it hadn’t expanded services across all of Hong Kong yet. Things changed quickly over the next few months. By December, if we only look at food delivery orders(excluding self-pickup and grocery orders), Keeta’s share of the market jumped to 37%.
Yet it’s important to note that competitors Foodpanda and Deliveroo offer online grocery and self-pickup services in Hong Kong, contributing significantly to their order volumes and GMV. When including all services, Keeta’s market share by GMV actually stood at around 15% in Q4. In December, Keeta’s growth was unprecedented, it managed to own around 21% of market share in terms of GMV, with Foodpanda leading at 54% and Deliveroo at approximately 25%.
Price Play: Keeta’s lower food delivery AOV
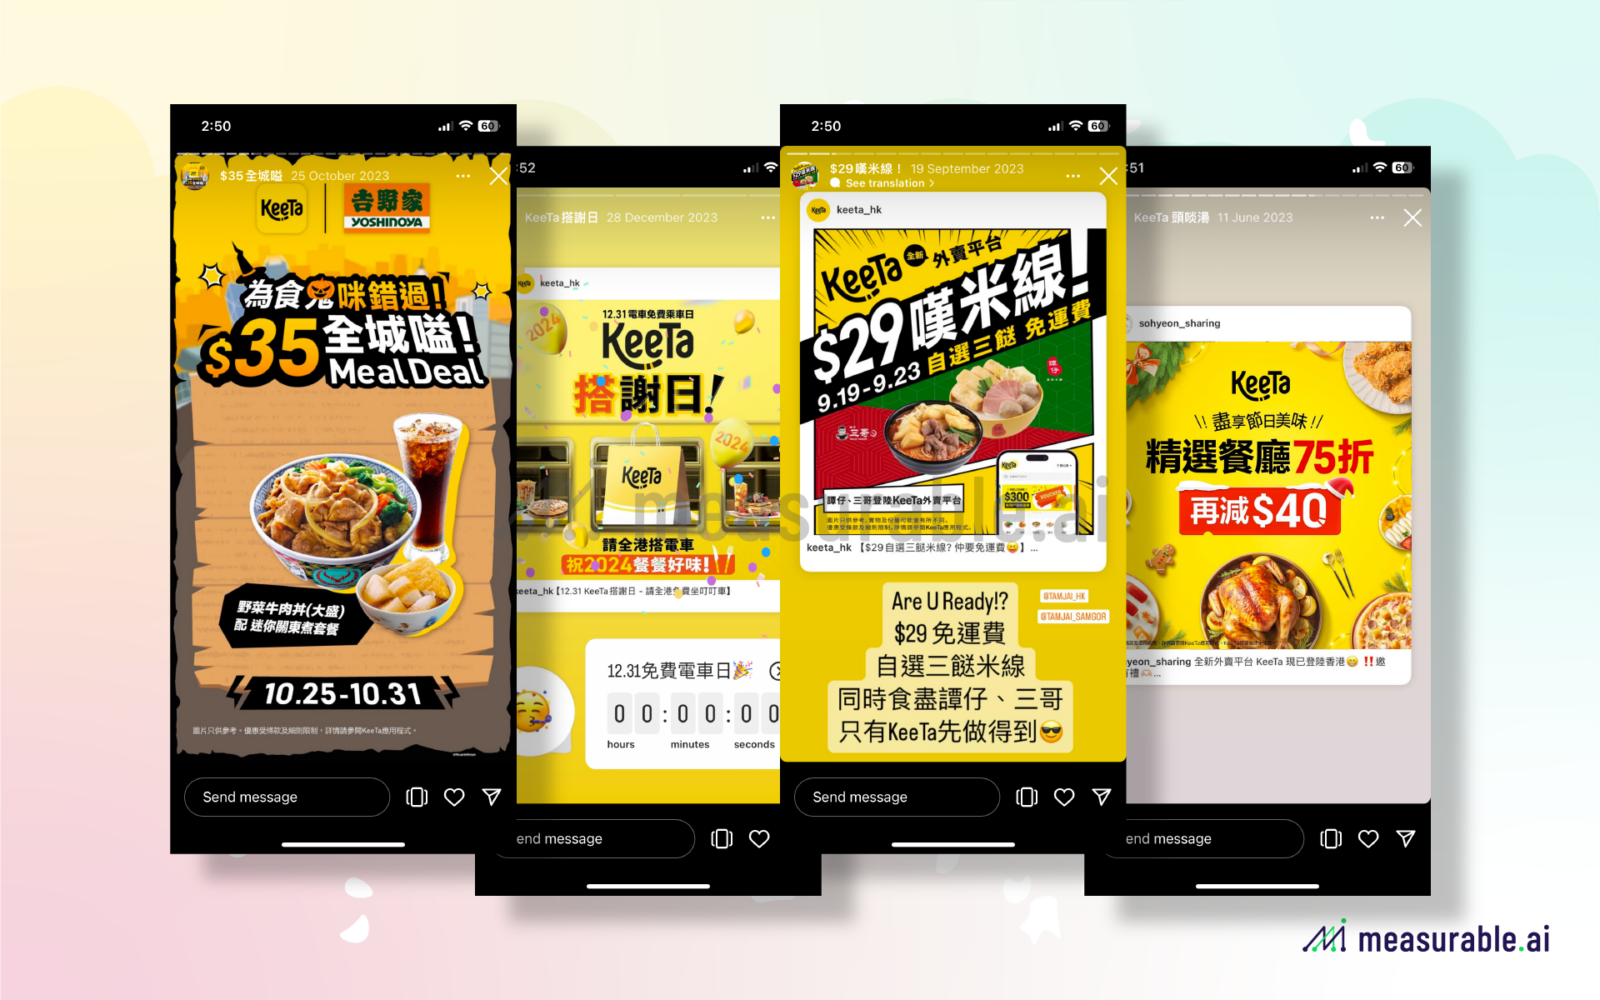
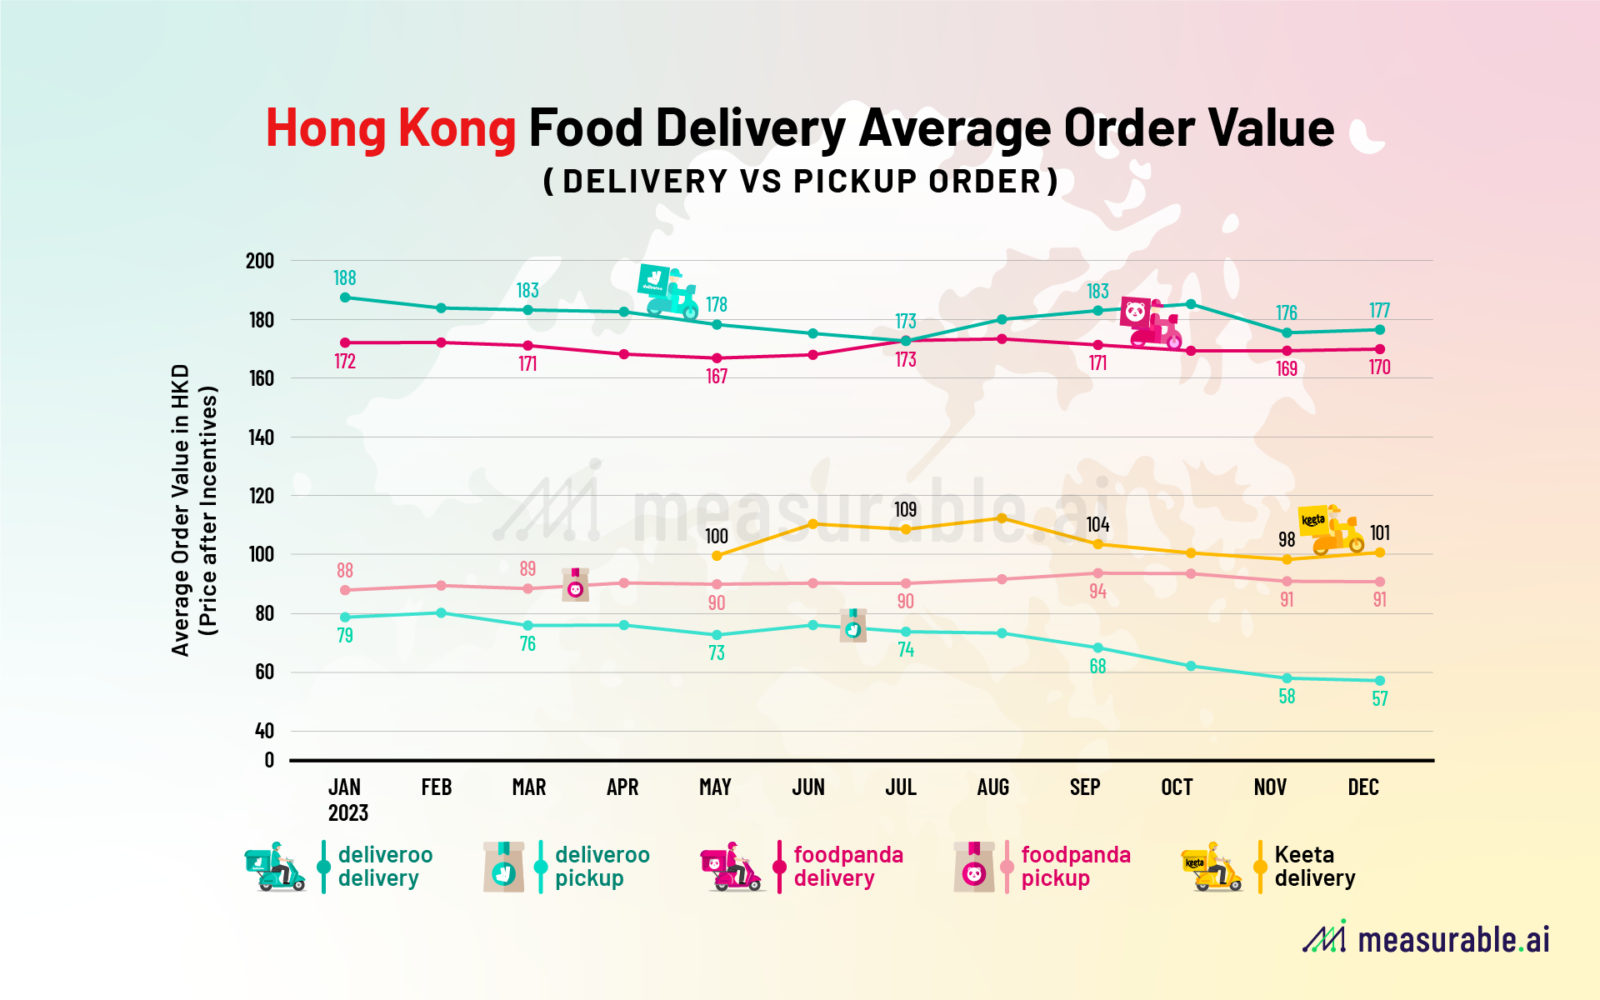
Keeta’s aggressive promotion campaigns in Hong Kong target orders with a notably lower Average Order Value (AOV) compared to its rivals. According to Measurable AI’s unique transactional e-receipts data, Keeta’s average order value in Hong Kong stands at around HKD 102, while the AOV for its competitors typically ranges between HKD 170 to 180 throughout the year. Notably, Keeta’s delivery order AOV is just marginally higher than the AOV for self-pickup orders from Foodpanda and Deliveroo.
What Keeta is missing?
Compared to its rivals on the market, Keeta doesn’t offer online grocery delivery, pickup service, or membership yet.
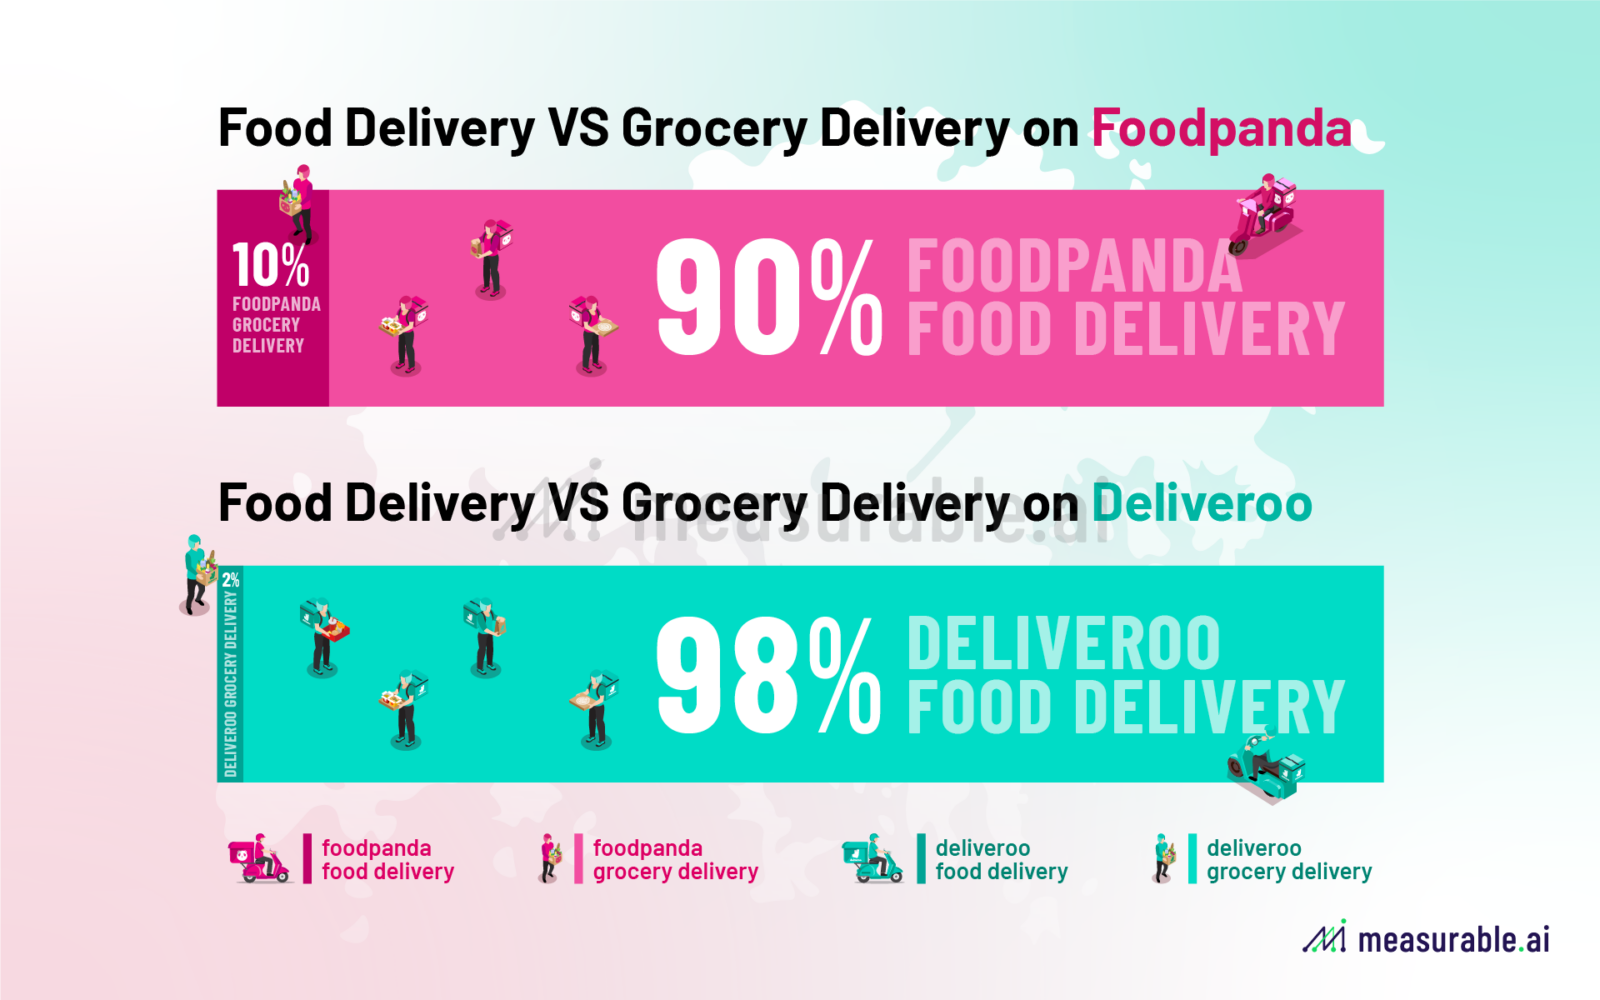
While Keeta’s growth in food-only and delivery-only orders is remarkable within a short period of time, it’s important to consider other aspects of the business as well. In the past few years Foodpanda and Deliveroo have already established a significant presence in online grocery deliveries with their proprietary services, Pandamart and Deliveroo Hop (which requires brick-in-mortar dark stores), along with partnerships with other grocery merchants. This segment also constitutes a substantial portion of their total sales. Notably, Foodpanda’s online grocery orders accounted for nearly 10% of its total GMV in 2023 in Hong Kong, as revealed by Measurable AI’s e-receipts panel in Hong Kong.
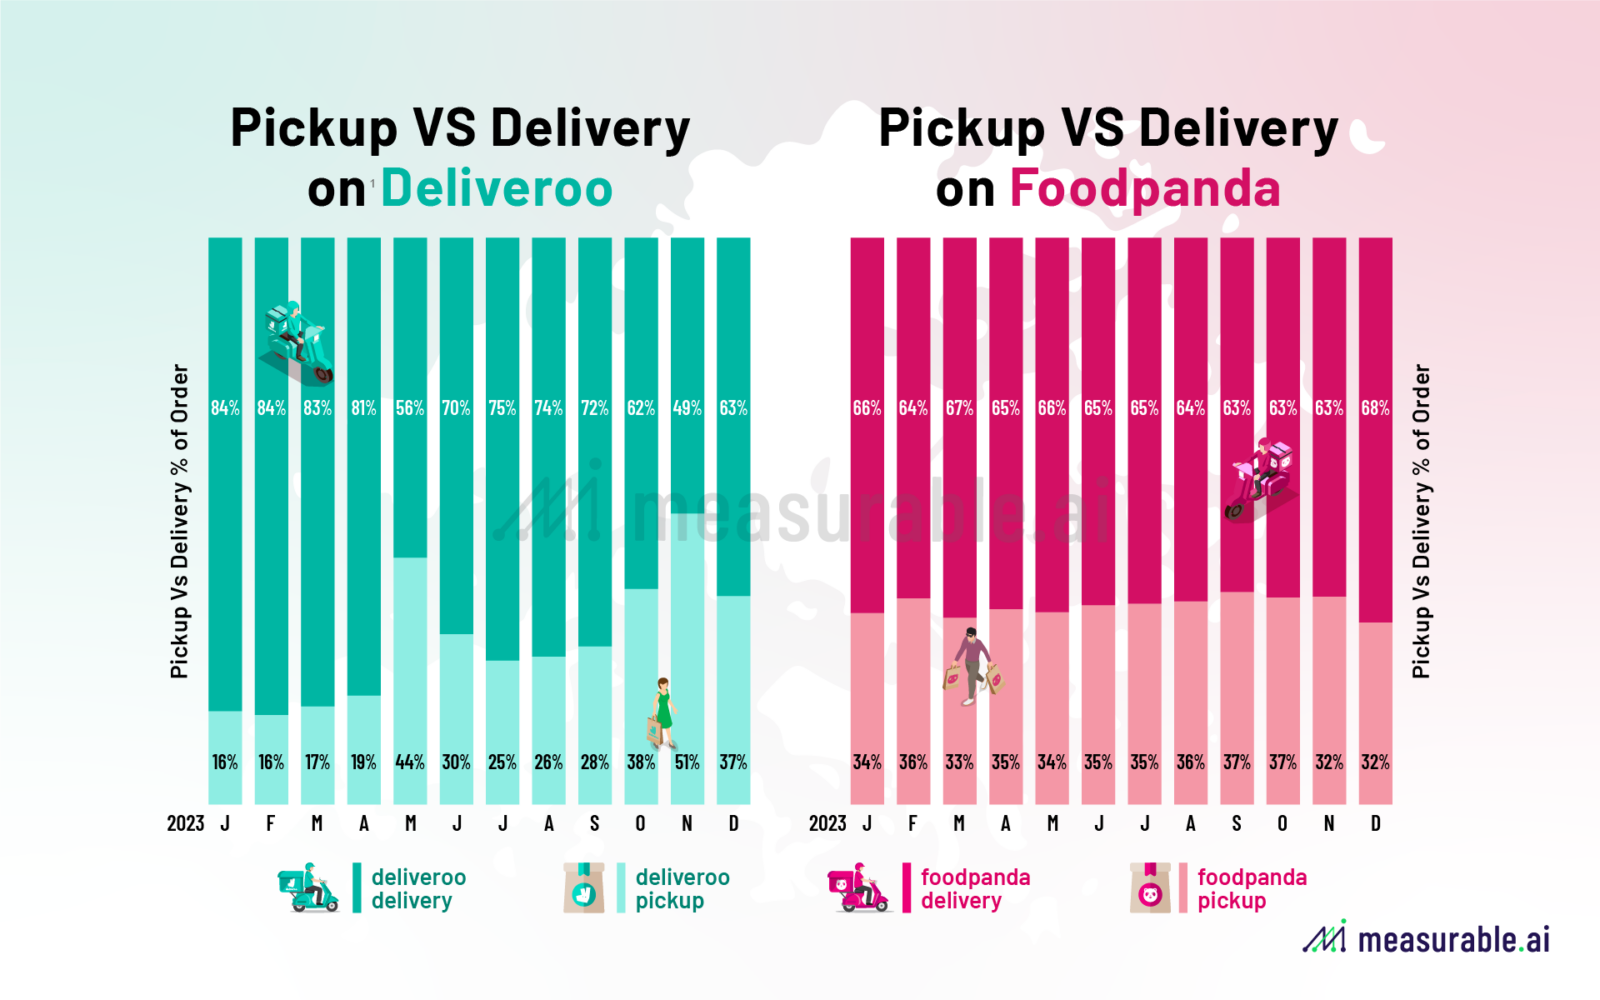
Another important aspect of the food delivery business today is the self pickup service, which are taking up bigger market share for the food delivery companies. After covid, the self pick-up service has become a growing trend favoured by both users and the food delivery platforms. With a much lower operation cost the platform still manages to enjoy a decent takerate of the orders, while having users stick to using the apps.
In 2023, both Foodpanda and Deliveroo continue to run promotions on orders with self pickup, as Measurable AI’s data shows in 2023 around 35% of the orders on Foodpanda are pickup orders, while for Deliveroo the portion also grew from around 16% to a whopping 37% over the year. It’s interesting to see how pickup orders will grow in the next year for the two companies.
The last piece Keeta is missing at the moment is the premium membership service. Foodpanda and Deliveroo offer its mature premium membership which allows users to enjoy exclusive deals and free deliveries. Deliveroo Plus and Panda Pro both own a decent percent of premium users among their user base. According to Measurable AI’s unique dataset, the loyalty among users with membership is significantly higher than average users.


Previously the Hong Kong Competition Commission published proposed commitments from Foodpanda and Deliveroo, addressing concerns that certain requirements on their partnering restaurants may harm competition. Just late last month, the Commission accepted the commitments by the two companies to revise their agreements with partner restaurants, allowing them more freedom to work with multiple delivery platforms and set their own pricing. However, these changes exclude partnerships with Keeta, as it already exceeds the market share threshold defined for smaller platforms at 10%.
To rewind the food delivery market in Hong Kong in the past five years: there were three players – UberEats, Foodpanda, and Deliveroo – once vied for dominance. Deliveroo used to lead the pack with over 60% of the market share in 2019. However, the pandemic shifted the game, with Foodpanda and Deliveroo splitting the market almost equally, and UberEats scooping up a modest 5% before bowing out at the end of 2021. Post-UberEats, Foodpanda gained momentum, securing over 60% of the market share by revenues from 2022.
Stay tuned as we continue to monitor the Hong Kong food delivery race between Keeta, Foodpanda, and Deliveroo.
At Measurable AI, we build and own a unique consumer panel and are the largest transactional email receipt data provider for the emerging markets. We are well regarded for our comprehensive alternative dataset across the digital economy, particularly for our consumer insights relating to the food delivery industry. To unlock more detailed analysis including user loyalty/retention rate, overlap analysis, and incentive trend, please schedule a demo with us, and sign up to our upcoming 2024 Digital Economy Annual Report.
About Measurable AI
Charlie Sheng is a serial entrepreneur, and a dedicated communicator for technology. She enjoys writing stories with Measurable AI’s very own e-receipts data. You can reach her at [email protected].
At Measurable AI, we build and own a unique email receipt consumer panel and have become the largest transactional email receipt data provider for the emerging markets. We are well regarded for the granular insights that can be extracted from our comprehensive datasets across the digital economy, including travel, e-commerce, digital entertainment, food delivery and ride-hailing.
Check out our latest Reports: 2019-2022 Food Delivery Annual Report for Asia, Asia & Americas Ride-hailing Report 2019-2023.
*The Content is for informational purposes only, you should not construe any such information or other material as investment advice. Prior written consent is needed for any form of republication, modification, repost or distribution of the contents.
![]()
