The Psychology of Discounts: Temu vs Shein
It’s an art to give away incentives to consumers. Sometimes, even when two promotions offer the same value of savings, the way they are presented can profoundly change how consumers shop. At Measurable AI, we help our clients understand digital companies, such as e-commerce platforms, through data. Our proprietary, granular SKU-level transactional e-receipt data enables us to examine details such as promotions and discounts. In this blog, we’re showcasing our e-commerce datasets by analyzing the incentive strategies of rising e-commerce players Temu, Shein, along with incumbents Shopee and Lazada.
Different Deals: Temu and Shein’s Discount Strategies
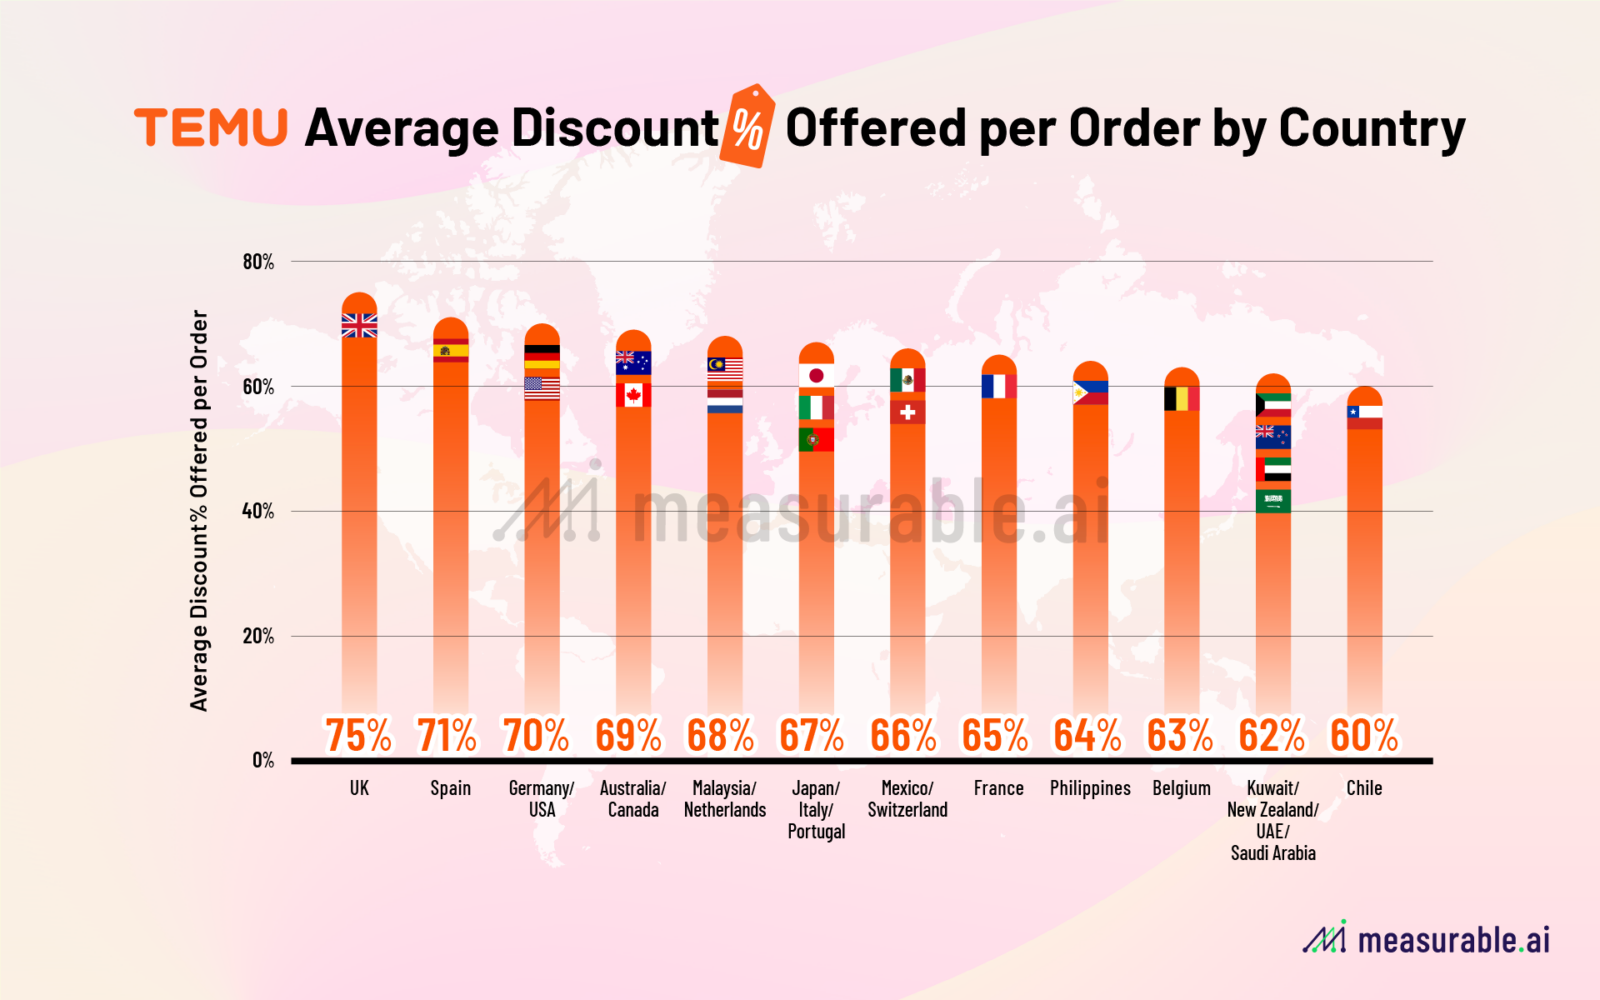
Both Temu and Shein are known for their competitive pricing, yet their approaches to discounts are different. Our analysis from Measurable AI’s unique e-receipt panel reveals that Temu is offering exceptionally high discounts to consumers, with orders averaging between 60% and 75% off across all markets.
For instance, in Chile, the average discount rate on Temu orders is 60%, whereas in Southeast Asian markets like Malaysia, it reaches approximately 68% per order. UK users enjoys the highest discount at around 75% off per order in first half 2024. It’s like Black Friday every day on Temu.
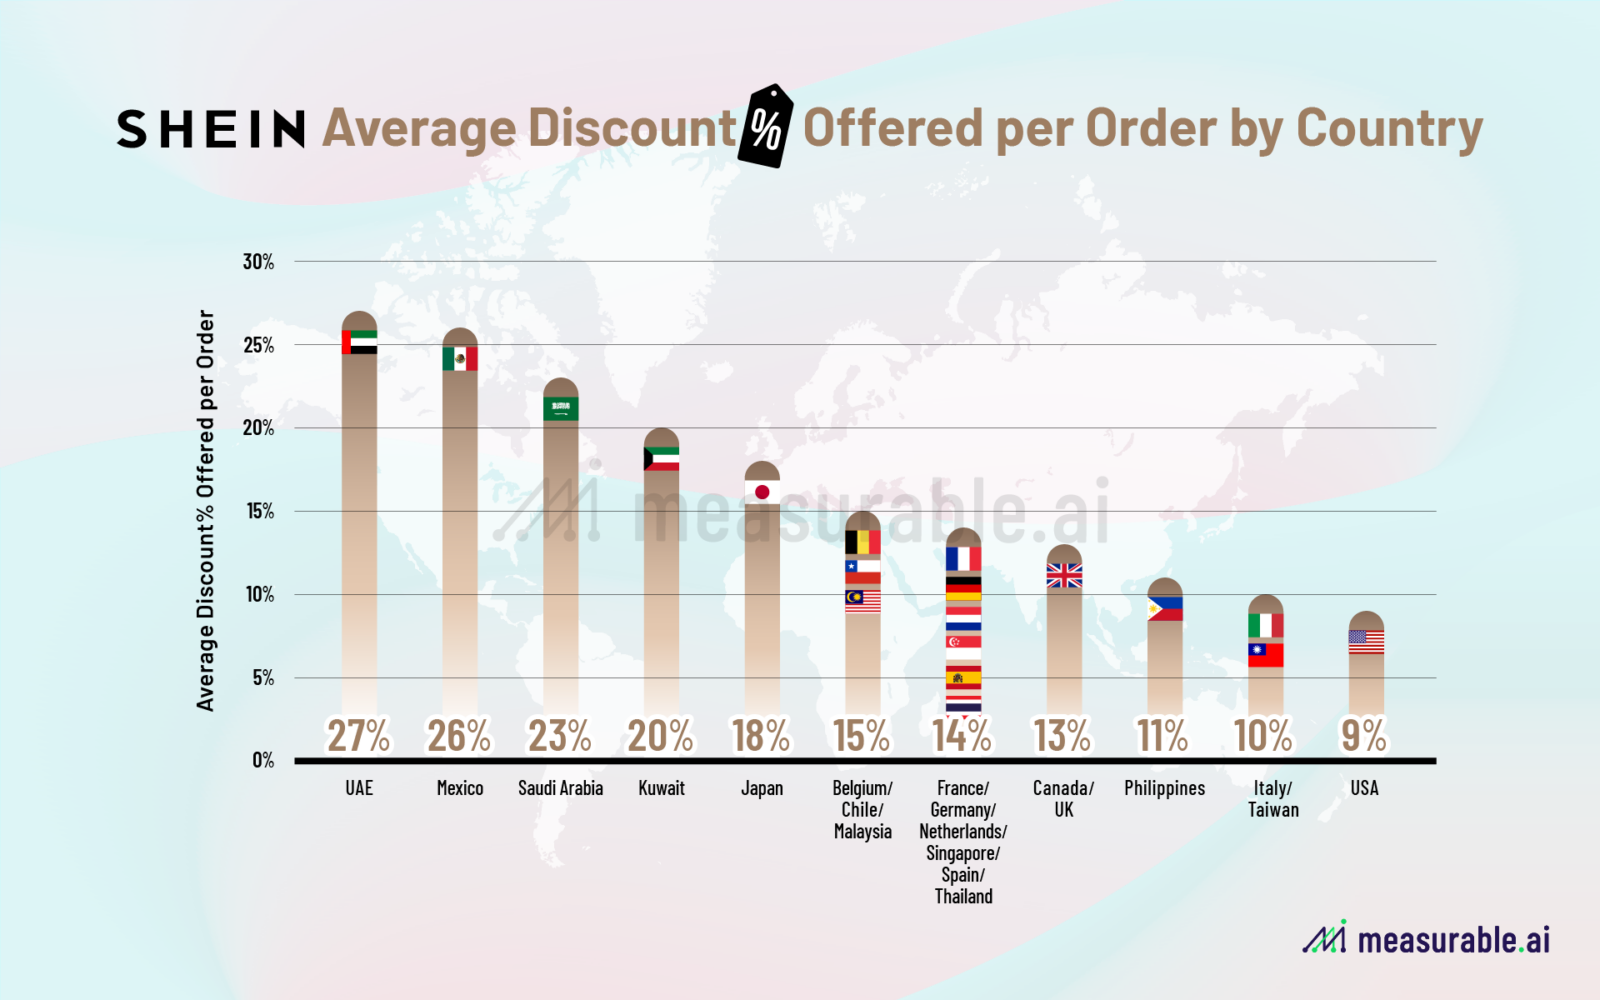
Shein plays it differently by applying much smaller discounts compared to Temu, with orders typically receiving around 15% off the original listed prices. As illustrated in the chart below, in the US, the average discount rate on Shein orders is around 9%, one of the lowest across various markets in the first half of 2024. In most markets where Shein operates, the discount rate remains under 30%, with reductions ranging from 9% to 27%.
Precision in Pricing: The Psychological Impact
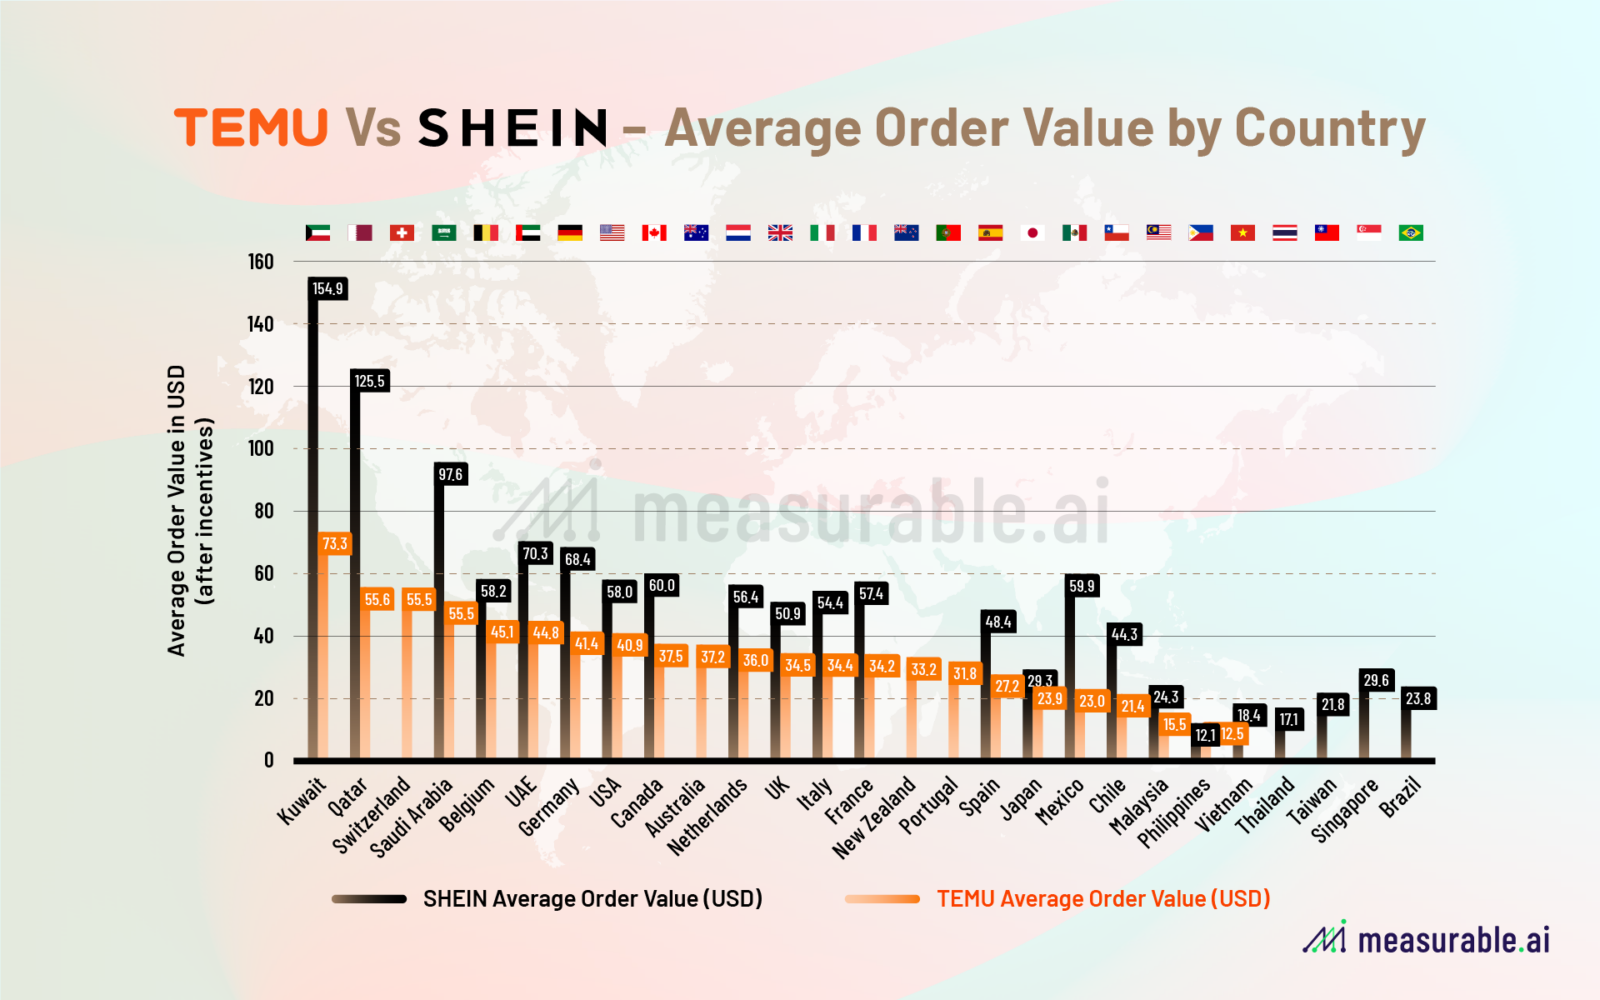
Wait, but aren’t they both offering very competitive prices to consumers? Indeed, Temu and Shein’s different incentive strategies extend into their pricing techniques as well. The original price listed on Shein’s website is significantly high, which partly explains why their substantial discounts seem more alluring. According to Measurable AI’s granular e-receipt data, after discounts are applied, Shein’s users typically spend more than those shopping on Temu.
This spending pattern is especially pronounced in Middle Eastern countries such as Kuwait and Qatar, while in Asian markets like Japan, the Philippines, and Malaysia, the gap is smaller. In the first half of 2024, Shein users on average spent $58 in the US, $24 in Brazil, and $30 in Singapore; in contrast, Temu users spent approximately $40 in the US, $34 in the UK, and just $12 in the Philippines.
Moreover, both companies apply discounts with remarkable precision, such as 26% off a $5.17 USD phone case or a staggering 96% off a $31.09 USD necklace. The prices listed on their products typically feature two decimal places, reflecting the exactness of their discount calculations. This approach to pricing has been validated by research, which indicates that consumers are more inclined to buy products with precise discounts. For example, precise discounts like 6.8% versus a round 7% actually drive more sales.
Incumbents vs Challengers: Incentive Rates Across Platforms
Both Temu and Shein continue to heavily employ incentives, according to Measurable AI’s data. For instance, in the first half of 2024, around 59% of all Shein orders included incentives, while Temu saw an even higher rate, with about 85% of its orders featuring incentives.
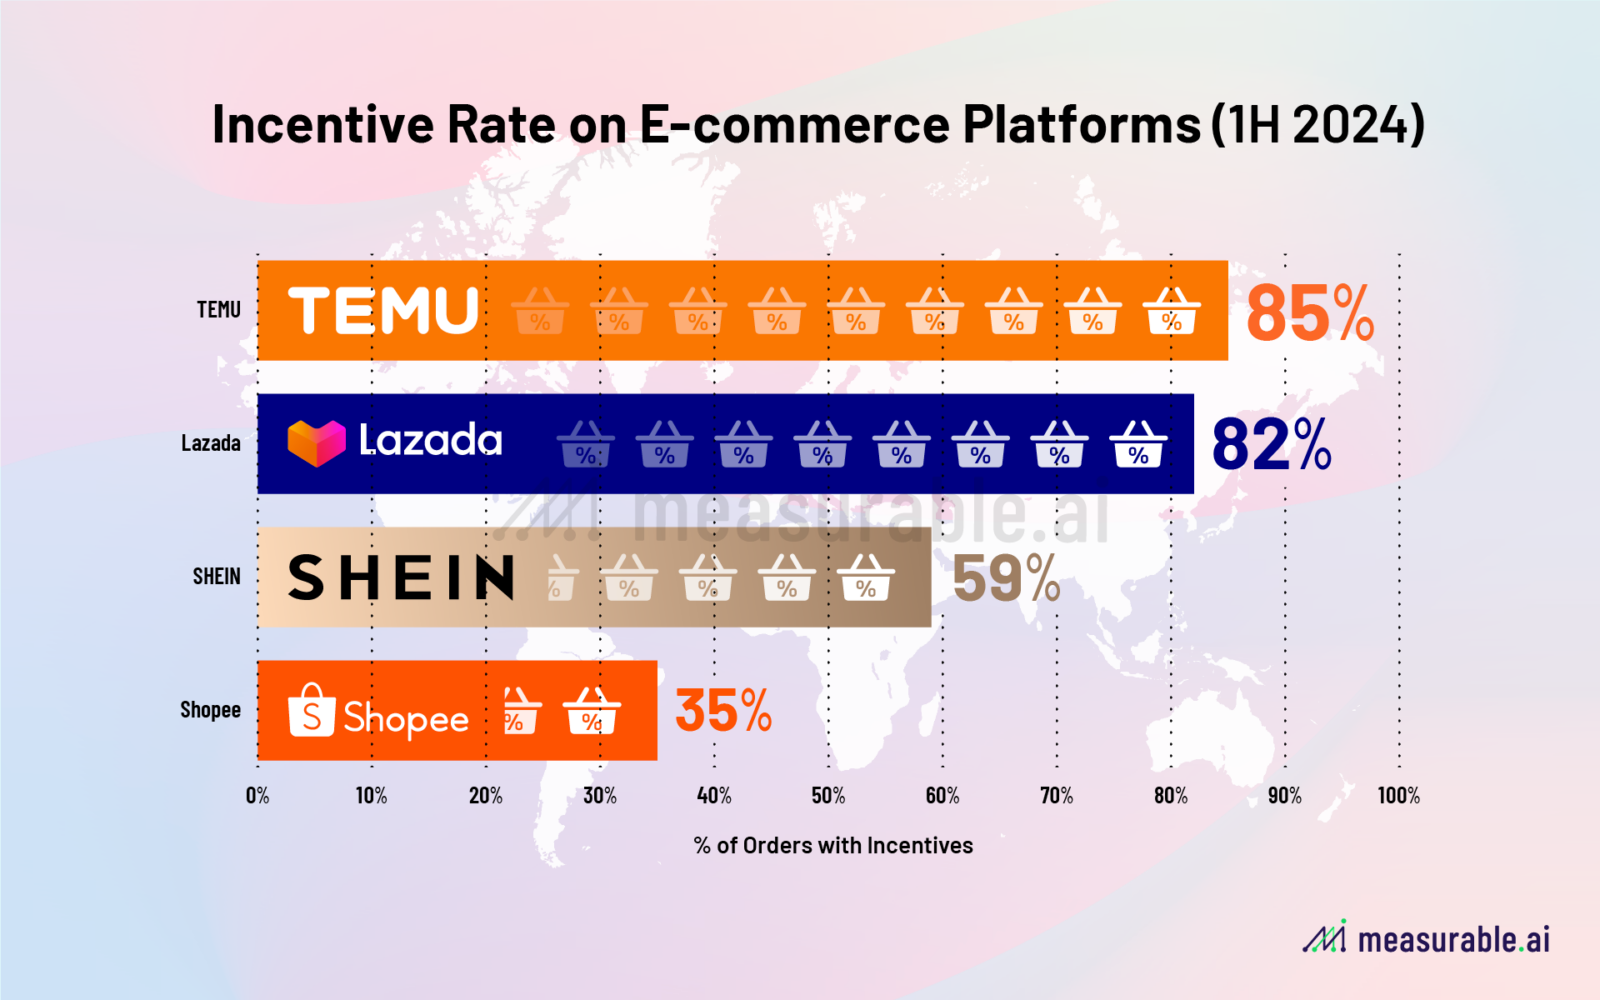
Will the incentive rate on these platforms slow down for incumbents? The answer varies. Our data from the same period reveals that incentive usage differs significantly among established players: approximately 35% of all Shopee orders included incentives, whereas for Lazada the rate is around 82%.
By understanding the nuances of these strategies, e-commerce platforms can better optimize their promotion campaigns. At Measurable AI, we remain committed to providing consumer insights with actual purchase data, helping clients to stay ahead in a competitive environment. To unlock more detailed analysis for more e-commerce players including Tik Tik Shop, Flipkart and metrics including user loyalty/retention rate, overlap analysis, please schedule a demo with us, and download our 2024 Digital Economy Annual Report.
About Measurable AI
Charlie Sheng is a serial entrepreneur, and a dedicated communicator for technology. She enjoys writing stories with Measurable AI’s very own e-receipts data. You can reach her at [email protected].
Check out our annual reports: 2024 AltAsia Online Delivery Report, 2019-2022 Food Delivery Annual Report for Asia, Asia & Americas Ride-hailing Report 2019-2023.
*The content is for informational purposes only, you should not construe any such information or other material as investment advice. Prior written consent is NEEDED for any form of republication, modification, repost or distribution of the contents.
![]()